Are Solar Panels Worth It?
Last Updated: 16th Jan 2026 By Ronald Brakels
People considering solar want to know, “Will solar panels save me money?” or simply, “Is solar a good investment?“
The answer — for those with a mostly unshaded roof and electricity consumption anywhere close to normal — is, hell yes!
This page covers how much solar can save you, how long it takes to pay for itself, and how it compares to other investments.
Table of Contents
- How Quickly Do Solar Panel Systems Pay Themselves Off Across Australia?
- How Much Do Solar Panels Save Me Over The Years?
- Use More Electricity – Get More Solar Savings
- Larger Systems Give More Savings
- Over 30 Years Of Savings
- What If We Invested That Money in Something Other than Solar?
- Solar Increases Home Value
- Conclusion
- Savings Assumptions
How Quickly Do Solar Panel Systems Pay Themselves Off Across Australia?
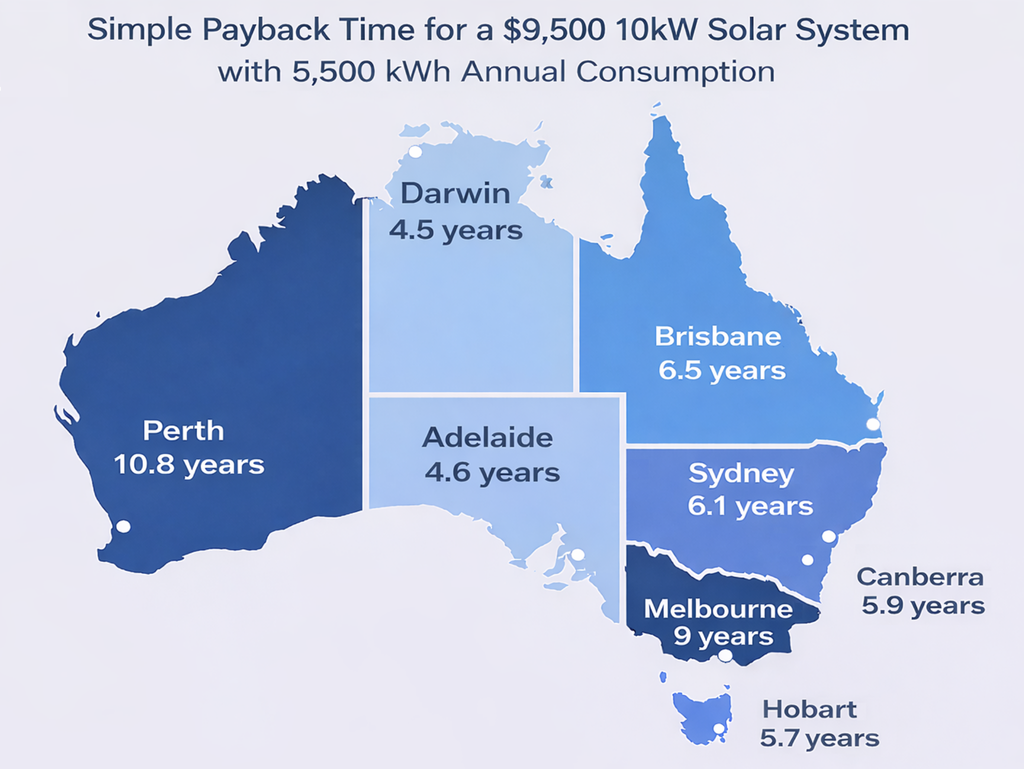
Most solar systems pay for themselves in 4-7 years. This is the simple payback time, which is how long it takes for the savings on electricity bills to equal the cost of the system. It’s affected by your electricity consumption, location, and the size of your system.
Here’s how how quickly a $6,000 6.6 kW system and a $9,500 10kW system can pay for themselves for Australian households consuming 5,500 kWh per year, which is around the Australian average for a 2 person home:
| Simple Payback Period (5,500 kWh consumption) | 6.6 kW system ($6,000) | 10 kW system ($9,500) |
|---|---|---|
| Adelaide | 3.6 years | 4.6 years |
| Brisbane | 4.8 years | 6.5 years |
| Canberra | 4.8 years | 5.9 years |
| Darwin | 3.8 years | 4.5 years |
| Hobart | 4.8 years | 5.7 years |
| Melbourne | 7 years | 9 years |
| Perth | 5.7 years | 10.8 years |
| Sydney | 4.5 years | 6.1 years |
But many homes consume more than 5,500kWh per year. Here are simple payback times for 6.6 kW and 10 kW solar systems consuming and 7,600 kWh per year, which is around the Australian average for households with 3 or more people:
| Simple Payback Period (7,600 kWh Consumption) | 6.6 kW system ($6,000) | 10 kW system ($9,500) |
|---|---|---|
| Adelaide | 2.9 years | 3.9 years |
| Brisbane | 3.8 years | 5.3 years |
| Canberra | 4.8 years | 5.9 years |
| Darwin | 3.6 years | 4.5 years |
| Hobart | 4.3 years | 5.7 years |
| Melbourne | 5.4 years | 6.9 years |
| Perth | 4.4 years | 7.9 years |
| Sydney | 3.6 years | 4.9 years |
Curious about how we calculated these payback periods? Read on!
How Much Do Solar Panels Save Me Over The Years?
Rooftop solar can rapidly pay for itself on a mostly unshaded roof anywhere in Australia. Our Solar & Battery Calculator give an estimate of its simple payback period for any postcode.
Here are savings estimate for north facing solar systems with 6.6 kW and 10 kW capacities with average electricity consumption for 2 and 3+ people households.
Scenario #1: How Much Would a 6.6 kW Solar Panel System on a Home with 5,500 kWh of Annual Consumption Save You?
Here’s how much you can expect to save with a 6.6 kW, north facing, solar system after 5, 10, and 15 years with an annual consumption of 5,500 kW — the average for a 2 person household:
| Savings with 6.6 kW (5,500 kWh consumption) | 5 Years | 10 Years | 15 Years |
|---|---|---|---|
| Adelaide | $8,550 | $17,100 | $25,650 |
| Brisbane | $6,250 | $12,550 | $18,800 |
| Canberra | $6,400 | $12,750 | $19,150 |
| Darwin | $7,900 | $13,800 | $19,700 |
| Hobart | $6,400 | $11,350 | $16,300 |
| Melbourne | $4,650 | $9,300 | $13,950 |
| Perth | $5,350 | $10,650 | $16,000 |
| Sydney | $6,700 | $13,400 | $20,100 |
The two exceptions are Melbourne and Perth, but there’s good news for these cities. In Victoria, there’s a $1,400 rebate for most residential solar, while Perth has the lowest-cost solar in Australia.
A good financial return is not the only reason to have solar. Although if that’s what you’re after, a lower-cost system will help – but only if it’s reliable and well installed. I do not recommend getting a cheap system from an installer without a reputation for quality. Chasing the cheapest system runs a real risk of turning into an expensive mistake. But if you use SolarQuotes, you can relax as we’ll only put you in touch with installers who do quality work. We back this up with our Good Installer Guarantee.
Use More Electricity – Get More Solar Savings
The savings estimates above assumed an electricity consumption of 5,500 kWh per year. This is around the Australian average, but the average Australian home only has 2.6 people and doesn’t have an electric car. Plenty of households use more electricity than this, and consumption is only likely to increase as people move away from gas and buy EVs.
Below are savings estimates for homes with an annual consumption of 7,600 kWh, which is the average consumption for a home with 3+ people.
Scenario #2: How Much Would a 6.6 kW Solar System on a Home with 7,600 kWh of Annual Consumption Save You?
| Savings with 6.6 kW (7,600 kWh consumption) | 5 Years | 10 Years | 15 Years |
|---|---|---|---|
| Adelaide | $10,600 | $21,150 | $31,750 |
| Brisbane | $7,850 | $15,750 | $23,600 |
| Canberra | $7,600 | $15,200 | $22,800 |
| Darwin | $8,950 | $16,100 | $23,300 |
| Hobart | $7,450 | $13,700 | $19,900 |
| Melbourne | $5,600 | $11,200 | $16,800 |
| Perth | $6,850 | $13,700 | $20,550 |
| Sydney | $7,700 | $15,450 | $23,150 |
Increasing annual electricity consumption from 5,000 kWh to 8,000 kWh increases the savings over the first five years by 18% to 43% depending on location. The largest increase occurs where feed-in tariffs are the lowest.
Larger Systems Give More Savings
While 6.6 kW is a common solar system size, it makes sense for most households to go larger than this. For the majority of homes—so long as it fits on the roof—I recommend installing 10 kW or more.
Below are the estimated savings over 15 years from installing a 10kW solar system for households with an annual consumption of 5,000 kWh and 8,000 kWh:
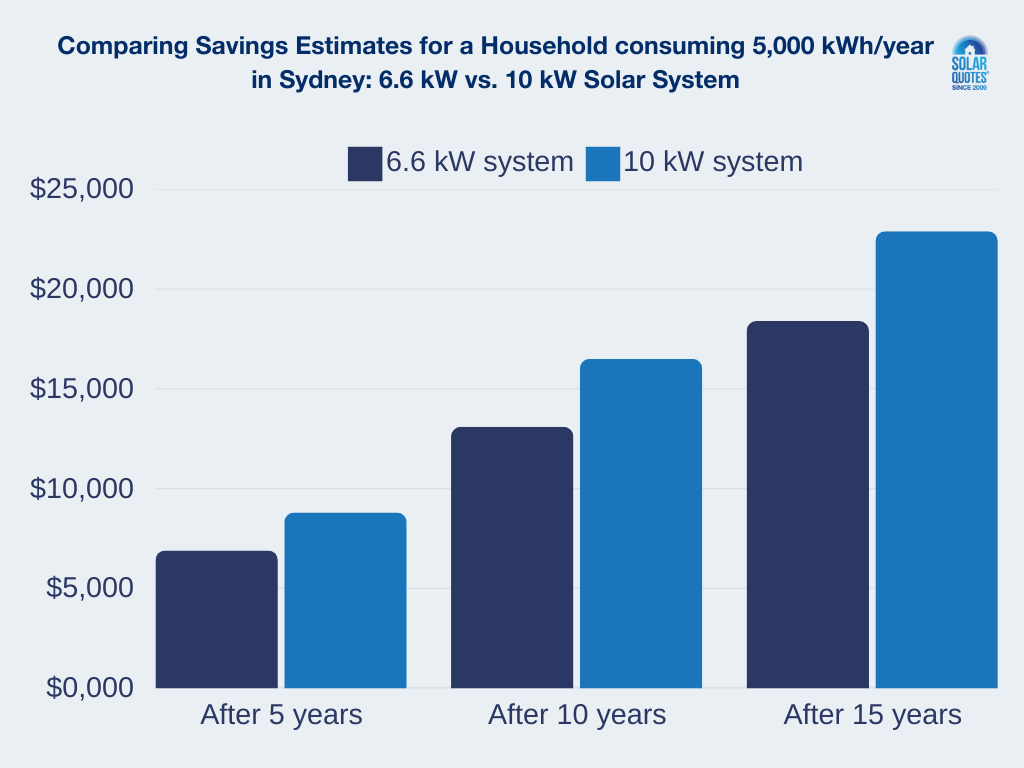
Scenario #3: How Much Would a 10 kW Solar System on a Home with 5,500 kWh of Annual Consumption Save You?
| Savings with 10 kW (5,500 kWhh consumption) | 5 years | 10 years | 15 years |
|---|---|---|---|
| Adelaide | $10,350 | $20,750 | $31,100 |
| Brisbane | $7,350 | $14,700 | $22,050 |
| Canberra | $8,100 | $16,200 | $24,250 |
| Darwin | $10,600 | $17,800 | $25,050 |
| Hobart | $8,450 | $14,350 | $20,250 |
| Melbourne | $5,900 | $11,800 | $17,730 |
| Perth | $4,400 | $8,800 | $13,200 |
| Sydney | $7,900 | $15,850 | $23,750 |
Now, let’s see how savings increase for a household that consumes an average of 7,600 kWh per year.
Scenario #4: How Much Would a 10 kW Solar System on a Home with 7,600 kWh of Annual Consumption Save You?
| Savings with 10 kW (7,600 kWh consumption) | 5 Years | 10 Years | 15 Years |
|---|---|---|---|
| Adelaide | $12,250 | $24,450 | $36,700 |
| Brisbane | $9,050 | $18,100 | $27,200 |
| Canberra | $9,400 | $18,800 | $28,200 |
| Darwin | $11,650 | $20,150 | $28,700 |
| Hobart | $9,400 | $16,550 | $23,650 |
| Melbourne | $6,900 | $13,750 | $20,650 |
| Perth | $6,050 | $12,100 | $18,150 |
| Sydney | $8,700 | $17,400 | $26,050 |
A 10 kW system provides considerably greater savings than a 6.6 kW system in every capital – with one exception. In Perth, solar systems over 6.66 kW cannot normally receive a feed-in tariff. If a household doesn’t have an annual electricity consumption of around 12,400 kWh, they’re likely to save more with a 6.6 kW system.
Outside of WA, big is beautiful. If a 10kW solar system costs $9,500, then its payback period will be modestly longer than for a 6.6 kW system installed for $6,000. However, it will continue to provide greater savings every year for what’s likely to be over 30 years, and this can definitely make a larger system worthwhile.
What Could Solar Savings Look Like Over 30 Years?
So far I’ve only shown savings out to 15 years but solar systems can last over 30 years. It’s now common for panels to have 25 or 30 year product warranties. Performance warranties of 30 years are also common.
While solar panels can easily last this long, solar inverters may not. While they can last a long time — my friend has one that has been working without problem for 23 years — It’s reasonable to budget for a replacement. It’s also a good idea to have your solar system inspected every 5 years and, depending on where you are, this may be a requirement.
The figures below allow for inspection costs, a replacement inverter, and a moderate fall in panel output over time. Note these are estimates only:
How Much Would You Save Over 30 Years? Comparing 6.6 kW and 10 kW Solar Systems With 5,000 kWh & 8,000 kWh Annual Consumption
| 30-year savings for a 6.6 kW system | 5,000 kWh Annual Consumption | 8,000 kWh Annual Consumption |
|---|---|---|
| Adelaide | $35,900 | $50,200 |
| Brisbane | $32,800 | $44,200 |
| Canberra | $28,900 | $36,900 |
| Darwin | $34,000 | $44,300 |
| Hobart | $30,000 | $39,500 |
| Melbourne | $22,700 | $32,000 |
| Perth | $26,600 | $41,000 |
| Sydney | $33,600 | $46,000 |
| 30-year savings for a 10 kW system | 5,000 kWh Annual Consumption | 8,000 kWh Annual Consumption |
|---|---|---|
| Adelaide | $58,100 | $74,600 |
| Brisbane | $41,000 | $52,200 |
| Canberra | $38,200 | $46,800 |
| Darwin | $43,000 | $53,800 |
| Hobart | $37,500 | $47,700 |
| Melbourne | $27,700 | $36,700 |
| Perth | $22,600 | $36,000 |
| Sydney | $41,000 | $53,700 |
These 30-year savings estimates are extremely speculative because no one really knows what will happen with electricity prices in 15 years, let alone 30. But the potential savings are high. Going by the above estimates, even a small 6.6 kW on a home with today’s average electricity consumption can save $30,000 or more in today’s money, depending on location. A 10 kW system on a home with 8,000 kWh annual consumption may be able to save over $50,000.
What If We Invested That Money in Something Other than Solar?
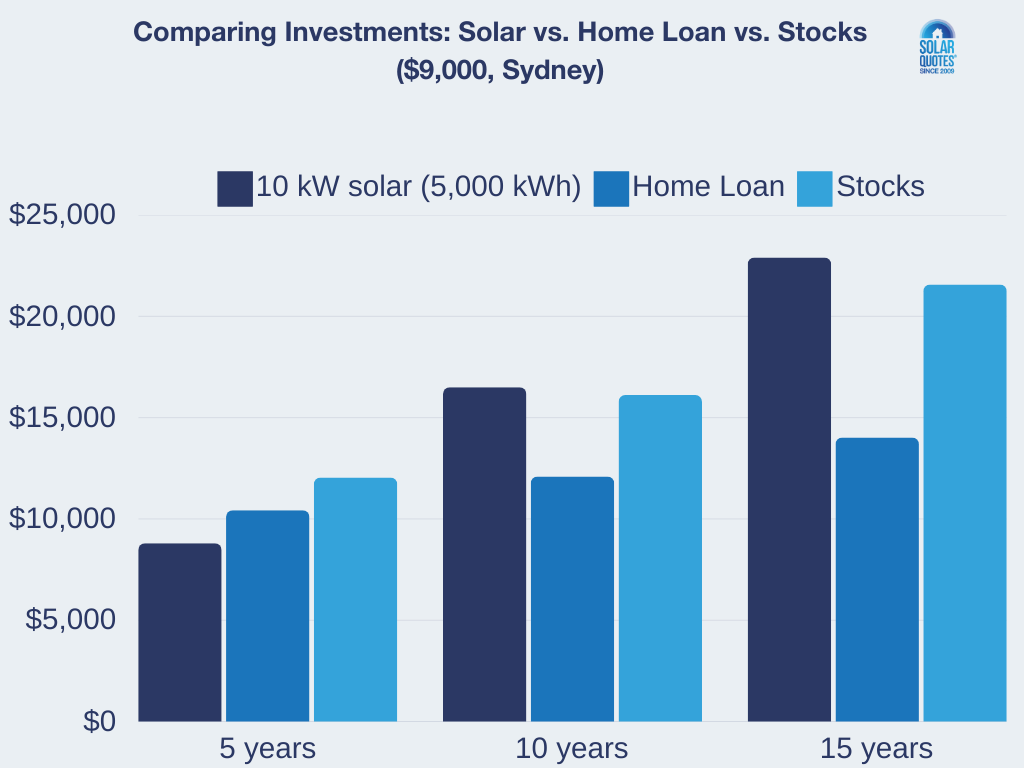
One thing we haven’t considered so far is opportunity cost. If $9,000 is spent on a solar system, the household loses the opportunity to spend that money on something else. This includes other investments. For most households, the main alternative investment is likely to be putting money towards a home loan.
Solar Vs. Home Loan
My home loan is currently 6%. But, after allowing for inflation, the real interest rate is closer to 3%. So you can compare the savings from solar to paying off a home loan, I’ve calculated how much $6,000 and $9,000 would be worth after 5, 10, 15, and 30 years at 3% real interest.
Value of $6,000 And $9,000 Invested At 3% Real Interest
| 5 Years | 10 Years | 15 Years | 30 Years | |
|---|---|---|---|---|
| $6,000 at 3% real interest | $6,956 | $8,063 | $9,348 | $14,564 |
| $9,000 at 3% real interest | $10,433 | $12,095 | $14,022 | $21,845 |
If you put $6,000 towards your home loan at a real interest rate of 3% or otherwise invested it at 3% real interest, after 5 years, you’ll have $6,956 in today’s money. This is better than the 5-year savings from a 6.6 kW solar system for a household with 5,000 kWh annual consumption in most capitals. But by year 10 solar is well ahead in every capital.
This makes solar a better investment than putting the money towards a home loan. Because solar provides a better return, a household can pay off their mortgage faster by getting solar and using the electricity savings to help pay off the home.
Solar Vs. High Return Investments
If you’re good at investing and able to get more than a 3% real return, it’s still hard to beat solar. Over the past 100 years, the Australian share market has averaged a real return of around 6.5%. But that’s with a lot of ups and downs. If, after taxes and other expenses, you can average a 6% real return from your investments, then after 5, 10, 15 and 30 years, $6,000 and $9,000 invested at that rate would come to…
Value of $6,000 And $9,000 Invested At 6% Real Interest
| 5 Years | 10 Years | 15 Years | 30 Years | |
|---|---|---|---|---|
| $6,000 at 6% real interest | $8,029 | $10,745 | $14,379 | $34,461 |
| $9,000 at 6% real interest | $12,044 | $16,118 | $21,569 | $51,691 |
If you compare these results to the savings estimates for solar, you’ll see that even for homes with only 5,000 kWh annual consumption, solar can provide a better return past 5 years, depending on location.
This means that even if you can get excellent average real return from your investments, it still makes sense to put solar on your roof. Particularly since the savings are consistent and tax free.
Even if you are some sort of hard-nosed investor who refuses to put money into anything without being sure of a real return of over 6%, you can still be confident of getting this with solar but you may need to install a system that’s smaller than what I normally recommend. This is because the higher the portion of solar generation you consume yourself, the better the return. But I still recommend installing a large system anyway so you’ll be ready for the future. After all, if you really are a great investor, you should be able to afford it.
Solar Increases Home Value
If you know you’re not likely to stay in your home long enough for solar savings to equal the return you’d get from putting the money towards your home loan, it can still make financial sense to install it. This is because solar adds to your home’s value, allowing you to recover a portion of the system’s cost when you sell your home.
Domain’s Sustainability in Property 2024 lists solar as the leading feature for energy-efficient (EE) homes, with 43% of EE homes in Australia having solar. Domain reports that EE houses sell for an average premium of 14.5% (~$112,000), while energy-efficient units sell for an average premium of 11.7% (~$70,000).
So if you think it will take at least 5 years for the savings from solar to make it a worthwhile investment, it doesn’t mean you won’t receive a worthwhile return if you move out after just three or four years.
Conclusion: Is Solar Worth It?
The numbers speak for themselves—solar is one of the best financial investments a homeowner can make. With payback periods as short as 4-7 years, most Australians will see significant electricity bill savings over time, with potential 30-year savings exceeding $50,000 for larger systems in certain places.
Beyond just cost savings, solar adds value to your home, provides energy independence, and supports sustainability. While alternative investments like paying off a mortgage or investing in stocks may seem attractive, solar provides consistent, tax-free returns with little risk.
For most households, the key takeaway is simple: if you have an unshaded roof and a suitable electricity plan, solar will almost certainly pay for itself and continue saving you money for decades. The only decision left is choosing the right system size and installer—both of which we can help with.
Savings Assumptions
The savings estimates above make solar look like a great investment. But their accuracy all depends on the assumptions I used. So you can see how they were made and decide for yourself if they should be adjusted up or down, here’s how I worked them out…
Electricity Consumption
I assumed annual electricity consumption is 5,000 kWh per year. This is close to the Australian average. While homes average a little more in Canberra and Hobart and less in Melbourne, using the same amount allows savings between capitals to be compared.
Consumption Patterns
The savings are based on results from our Solar & Battery Calculator, which assumes a typical electricity consumption pattern for the location. Homes that use more electricity during the day than usual will see greater savings, while those that consume more than usual at night will save less.
Current Electricity Prices
I’ve assumed that before solar is installed, households pay average electricity prices for their area and after getting solar they use electricity plans suitable for solar households.
Future Electricity Prices
No one can be certain what will happen with future electricity prices. While I suspect they’ll trend downwards, to keep things simple, I’ve assumed electricity prices will keep pace with inflation and there will be no price change in real terms over time. This means all savings figures are in today’s money and not adjusted for future inflation.
Feed-in Tariffs
Because solar feed-in tariffs are likely to fall in the future, I’ve assumed over the first 5 years available feed-in tariffs over 5c will average 1c lower. From years 6 to 10, feed-in tariffs will be two-thirds of their current rate, rounded up to the nearest cent. After that, they will be half their current rate, rounded to the nearest half cent.
Direction
I’ve assumed the solar panels face between NE and NW. Because they may not face the optimum direction, I’ll assume their output is 98% what it would be if they faced directly north.
Tilt
Most Australian roofs have a slope of either 15° or 22.5° and there’s little difference in solar output between the two. I’ve used a tilt of 20° as it’s a round figure between them.
Solar Output
Solar system output is based on PVWatts results. Note: panels going on Australian roofs these days are what PVWatts calls “premium panels”. I also used different figures from PVWatts defaults for system losses. For example, I assume no significant losses from shading.
Inverter Losses
Most modern solar inverters have an average efficiency of at least 97%, so I have assumed 3% inverter losses.
System Losses
I’ve assumed no significant losses from shade. Losses from wiring, panel mismatch, dirt on panels, minor shade very early or late in the day, availability, and other causes total 10%. With inverter losses and panel deterioration, this makes total system losses in the first 5 years around 14%.
Panel Deterioration
A reliable but low-cost modern solar panel usually has a performance warranty that allows it to degrade by a little over 8% after 20 years. But the actual amount of deterioration is normally much less. I’ve assumed panels suffer 1% deterioration in output immediately upon being installed and an additional 1% every 5 years.
Panel Cleaning
Normally rain is enough to keep panels clean, so it’s usually not necessary to pay for cleaning. But a 2% reduction in output is included in system losses to allow for the effects of dirt.
System Inspections
We recommend having your panels inspected every 5 years. In the ACT, SA, and VIC, it’s a DNSP requirement. These inspections can cost several hundred dollars. I have allowed $300 for an inspection after the end of each 5-year period.