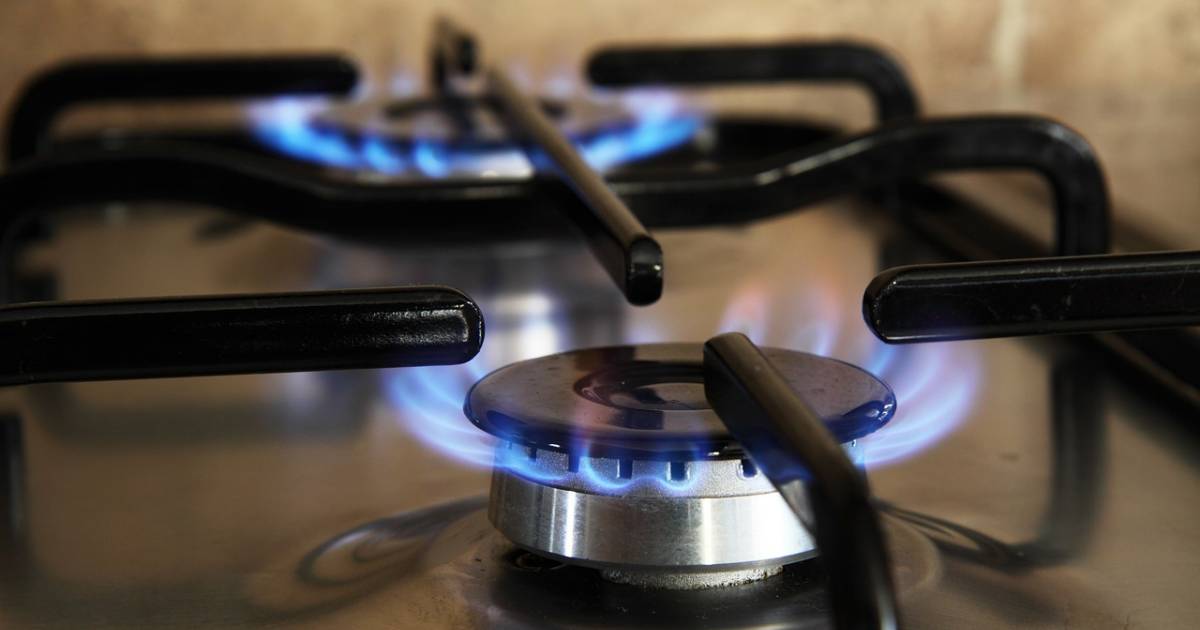
Gas consumption in Victoria in April was higher than in any of the preceding ten years according to The Australia Institute, resulting in approximately 200,000 tonnes more emissions than April 2019.
Commenting on TAI’s latest National Energy Emissions Audit, report author Dr Hugh Saddler said with more than 80% of Victorian households connected to gas supply and most using it for space heating, the result suggests working and schooling from home as a result of the COVID-19 situation is a culprit.
Dr. Saddler also stated while there has been an enormous reduction in aviation emissions in Australia, the same can’t be said for non-transport energy applications.
“Instead it has tended only to shift the source of our emissions – rather than using electricity for heating or computers in the workplace, people are running them from their homes. In Victoria, in particular, that means using lots more gas.”
It appears only Victoria may be experiencing this phenomenon, with no unambiguous evidence that the economic lockdown has affected gas consumption in New South Wales, South Australia and Queensland. These three states have far lower proportions of gas-connected homes and the connections are primarily used for cooking and heating water.
With regard to electricity consumption nationally, the report notes there seems to be very little difference this year compared with 2019 and 2018.
Say No To A Gas-Led Recovery
On a related note, earlier this month the Federal government signaled support for the National COVID-19 Coordination Commission’s proposed “gas-led recovery”.
“Gas is emissions intensive, expensive, one of the worst sectors to invest in for job creation and largely owned by foreign companies that pay little tax in Australia,” said Richie Merzian, Climate & Energy Program Director at The Australia Institute. “Meanwhile, our research shows renewables going from strength to strength.”
Mr. Merzian said the pursuit of gas will not only increase electricity prices but also worsen climate change, particularly once emissions from other sectors start to come back into play.
Australia’s Clean Energy Council released a report last month stating an economic recovery instead led by renewables and energy storage investment could create tens of thousands of jobs and drive down electricity prices.
Renewables Progress
On the topic of renewables, the TAI report includes a couple of interesting tables, showing the rise of renewable energy – but also coal’s continued dominance.
Shares of electricity generation in the year to December 2008 and the year to April 2020
| Year ending | December 2008 | April 2020 |
| Black coal | 58.6% | 53.4% |
| Brown coal | 25.8% | 16.8% |
| Gas | 9.2% | 9.2% |
| Hydro | 5.3% | 7.1% |
| Wind | 1.0% | 9.2% |
| Grid solar power | 0.0% | 3.0% |
| Rooftop solar power | 0.0% | 5.9% |
| Biomass (sugar mills) | 0.1% | 0.1% |
Growth in the renewable share of annual electricity generation, December 2008 to April 2020
| Year ending | December 2008 | April 2020 |
| New South Wales | 1.3% | 16.2% |
| Queensland | 1.8% | 14.2% |
| Victoria | 4.0% | 24.3% |
| South Australia | 12.8% | 56.0% |
| Tasmania | 87.4% | 98.3% |
The full National Energy Emissions Audit: May 2020 report can be downloaded here.


 RSS - Posts


Speak Your Mind