While the cost of installing a home solar power system remained well above $1 a watt in February on average in Australia, the value in having solar panels installed is only getting better.
The price per watt of fully-installed solar power systems (after all subsidies) increased in February compared to January in Queensland, Victoria, South Australia and Western Australia; but dropped in New South Wales and the ACT. Even with the increase in WA, it remained the cheapest state in February.
The table below shows the situation for February system purchases as at late last week. It’s based on pricing information provided in more than 300 solar installer reviews submitted to SolarQuotes as at March 24; covering solar sales contracts signed last month. Note that as new reviews come in, the figures below will likely change.
| State | Cost per watt (February 2022) |
Cost per watt (January 2022) |
Cost per watt (February 2023) |
| QLD | $1.02 | $1.07 | $1.12 |
| NSW | $1.14 | $1.18 | $1.15 |
| ACT | $1.37 | $1.43 | $1.34 |
| VIC | $1.06 | $1.00 | $1.08 |
| TAS | $1.21 | $1.33 | NA |
| SA | $1.02 | $1.17 | $1.08 |
| WA | $0.88 | $1.00 | $1.05 |
| NT | NA | NA | NA |
| AU | $1.04 | $1.09 | $1.11 |
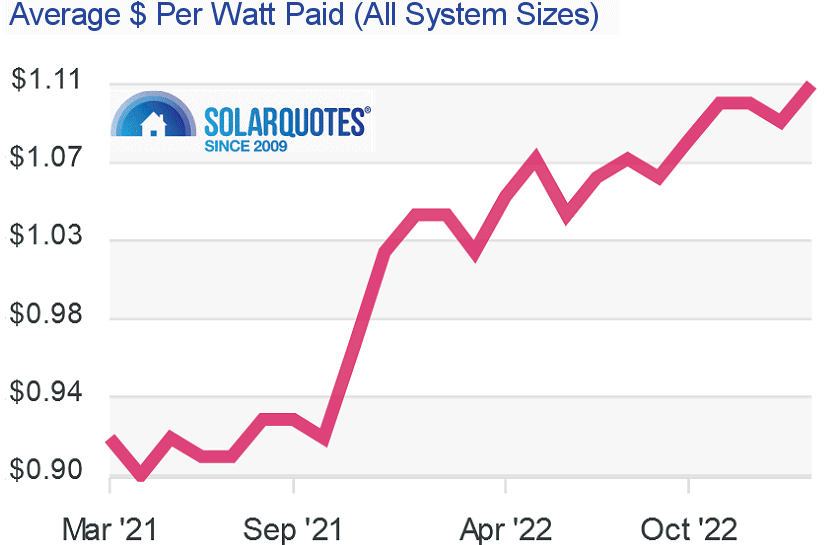
Average Cost Per Watt Since March 2021
The following graph indicates Australians were paying around 92c a watt installed on average in March 2021 compared to $1.11 in February this year. But given the situation with mains electricity supply since (and more power price rises to come), solar panels remain a slam-dunk decision for households with a suitable rooftop.
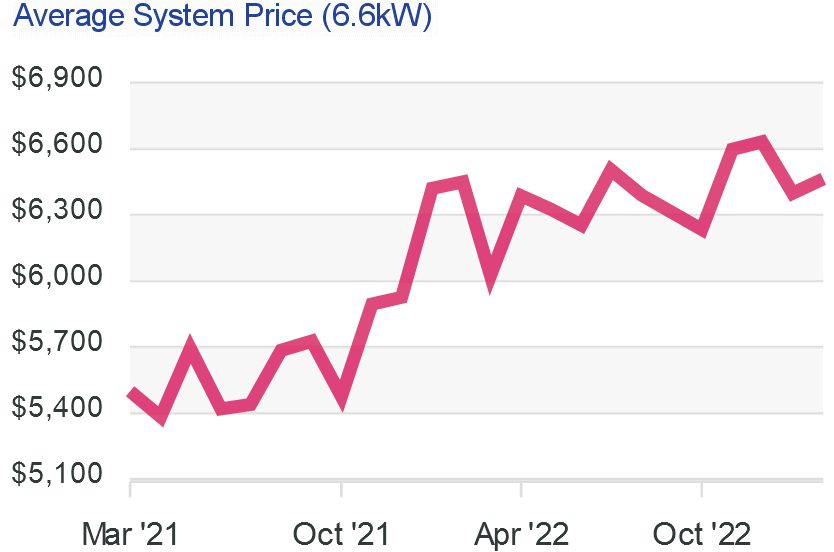
6.6kW And 10kW System Prices – February 2023
Average pricing for fully installed 6.6kW solar was fairly stable in February ($6,464) compared to January ($6,399) at this point.
10kW solar power systems were also pretty stable – $11,765 in February compared to $11,747 in January.
Note these averages will also change as new reviews with pricing information for February come in. The best way to keep tabs on pricing movements is to use the SolarQuotes Australian Solar Price Index, which is updated in near real-time and enables you to drill down by state and even component brands.
When using the tool (or reading these reports), bear in mind the figures are based on a broad range of component and install quality, and installation scenarios .
Another Rush On Solar Systems
If you haven’t installed solar panels yet, looking at the graphs might make you curse not going solar in the “good old days” of 2021. But with electricity prices skyrocketing since and more to come, it means now is actually a really good time to arrange an installation rather than wait for system prices to (perhaps) drop.
It’s something you probably want to arrange sooner rather than later – we’ve already seen a rush on quotes recently. And as the reality of the situation hits home, installers will become increasingly busy. But while a sense of urgency can be a good thing, rushing into a purchase decision isn’t. Make sure you do solar right so you’ll have a headache-free experience and years of tiny electricity bills.
To get an estimate right now of how much you could be saving on energy costs by going solar and how long simple payback will take, try SQ’s solar (and battery) calculator – it’s very easy to use.


 RSS - Posts


How good are goodwe inverters..?
They’re a solid budget choice in our view: https://www.solarquotes.com.au/solar101.html#inverterchart