Australians were paying more per watt for solar power systems on average last month, but there was a surprise in the popular 6.6kW category.
The following table shows installed system price per watt; all sizes and after all rebates and subsidies in December 2021 compared to November and also December 2020.
| State | Cost per watt (December 2021) |
Cost per watt (November 2021) |
Cost per watt (December 2020) |
| QLD | $0.96 | $0.94 | $0.91 |
| NSW | $1.10 | $1.03 | $0.94 |
| ACT | $1.32 | $1.24 | $1.04 |
| VIC | $1.00 | $0.98 | $0.91 |
| TAS | $1.34 | NA | $1.23 |
| SA | $1.00 | $0.95 | $0.92 |
| WA | $0.88 | $0.83 | $0.73 |
| NT | NA | NA | NA |
| AU | $1.01 | $0.96 | $0.91 |
The figures were sourced from Solar Quotes’ Australian Solar Price Index. It graphs what solar power systems cost in in each state and nationally for the previous 12 months. You can also drill down to a specific system size and even various inverter and solar panel brands used.
December 2021 figures are based on details provided by 317 solar buyers across the country who submitted installer reviews1 and chose to note what they paid. As the Index updated in real-time, figures above may change as it is updated when new reviews are submitted.
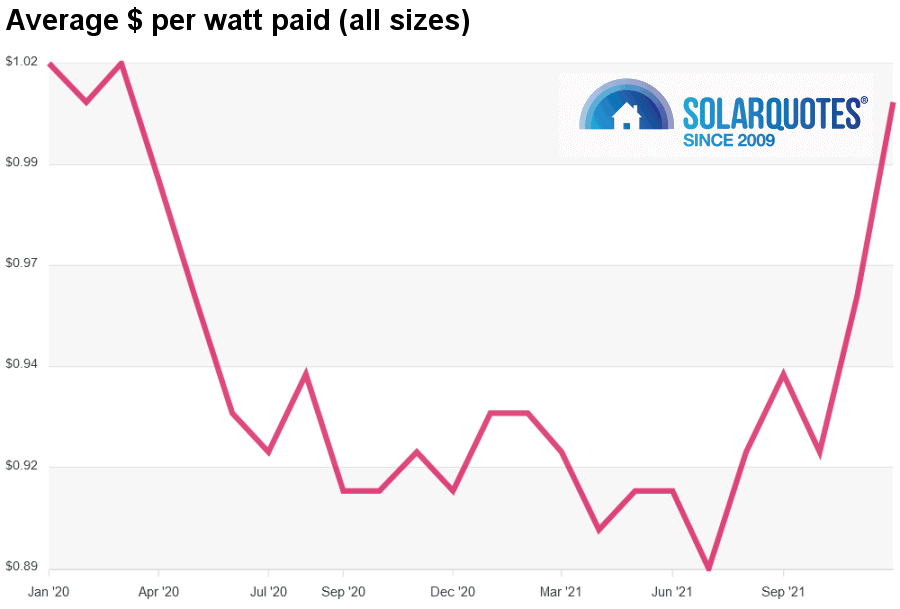
The following graph shows the national cost-per-watt picture (all system sizes) going back to January 2020.
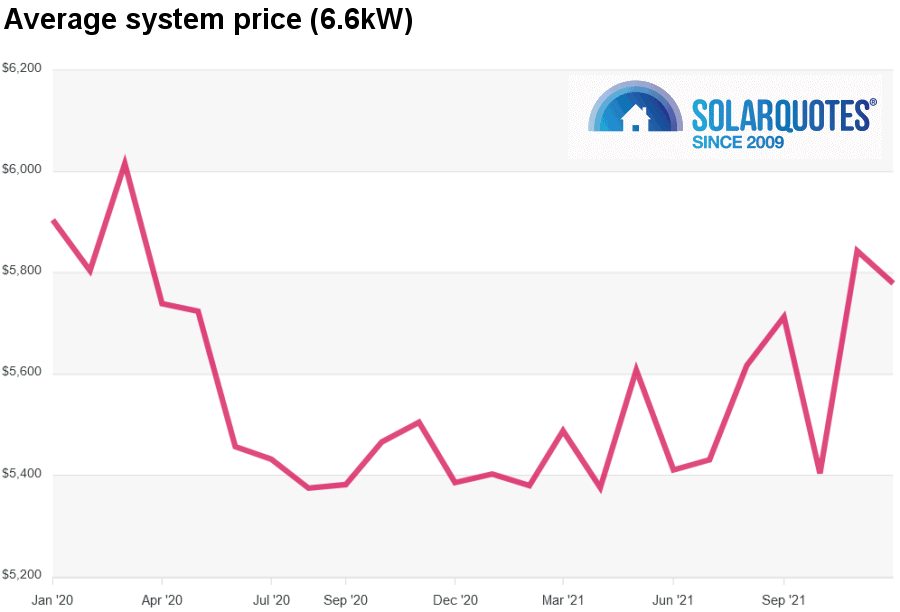
And the average price paid after rebates for a fully installed 6.6kW solar system specifically:
While the graph shows 6.6kW pricing remained pretty stable when averaged across Australia, digging deeper reveals increases in New South Wales, Queensland and South Australia offset by drops in Victoria and Western Australia.
What’s Happening With Solar Pricing?
Like many industries, the solar sector has been buffeted by the knock-on effects of the pandemic. There has been significant upwards pricing pressure on solar panels in particular, and shipping has become more expensive.
On the issue of solar panel pricing, our December report mentioned the cost of polysilicon – a crucial material used in the manufacture of solar cells – showed signs of easing.
Polysilicon spot prices reached more than USD $36/kg in early December, which was around three times the cost just a year ago, and 5 times the price pre-pandemic. The spot price was USD $32.22 on January 19, which was around the same as this time last month. There’s a bunch of polysilicon production capacity in the works that should help things along, assuming Murphy’s Law doesn’t kick in (again).
Another factor influencing pricing in December has to do with the solar rebate; i.e., the up-front subsidy for purchasing a system available nationally. At the beginning of each year, the level of subsidy reduces. As it is based on when a system is installed rather than purchased, many quotes in December 2021 would have taken into consideration a January 2022 installation.
Regardless of where system prices are now and where they might head, the best time to install solar panels is usually right now – otherwise you’ll just be forking out on electricity bills higher than they would otherwise be and any financial benefit from waiting for system prices to drop may instead go into the pocket of your electricity retailer. But before you take the leap to harvesting solar energy from your rooftop, check out Finn’s guide to buying solar power systems.
Footnotes
- Including reviews of solar installers not in the SQ network ↩


 RSS - Posts


Speak Your Mind