Western Australia had the cheapest solar power systems in Australia during July 2022 – and by quite a margin. See what Australians were paying for systems last month in the latest SolarQuotes solar price report.
Something curious happened last month – when we published July’s report indicating June pricing, Victoria was ahead in terms of cheapest cost per watt (just). This assessment was made based on buyers who let us know what they paid for their systems when submitting solar installer reviews. These reviews included those of installers not within the SolarQuotes network.
As these figures are generated in real-time by the Australian Solar Price Index tool as new information comes in, they are subject to change. In July’s report covering June, average cost-per-watt in Victoria at that stage was $0.92, cheaper than WA (93c). That report was prepared with probably around 8 days left in the month.
But as at yesterday, the tool is showing the average install cost for June in Victoria crept up to $1.00 a watt.
For July 2022 so far, we’re seeing WA again lead the pack for the cheapest solar power systems at 93c a watt on average; followed by Queensland at $1.01 and Victoria at $1.03. There was a significant drop in South Australia at this point, from $1.12 in June to $1.02 in July. The cost-per-watt figures in the table below are after all subsidies and include installation.
| State | Cost per watt (July 2021) |
Cost per watt (June 2022) |
Cost per watt (July 2022) |
| QLD | $0.90 | $0.99 | $1.01 |
| NSW | $0.97 | $1.11 | $1.11 |
| ACT | $1.02 | $1.08 | $1.44 |
| VIC | $0.84 | $1.00 | $1.03 |
| TAS | $1.05 | $1.36 | NA |
| SA | $0.91 | $1.12 | $1.02 |
| WA | $0.77 | $0.92 | $0.93 |
| NT | NA | NA | NA |
| AU | $0.90 | $1.03 | $1.05 |
Figures to date for July 2022 are based on 429 review submissions where system costs were noted, as at the time of preparing this report (August 22). Note that the figure for the ACT is based on few submissions, so a couple of particularly pricey systems are probably responsible for the spike.
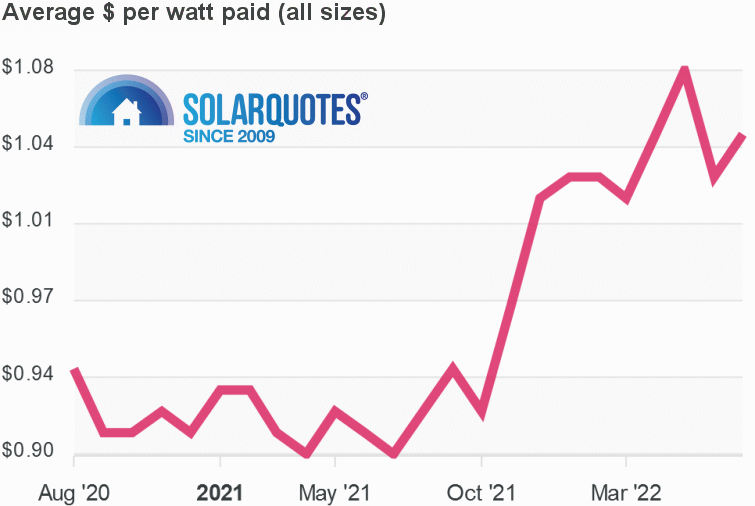
Historical Cost Per Watt Nationally
The following graph indicates average cost-per-watt across all system sizes nationally going back to August 2020. .
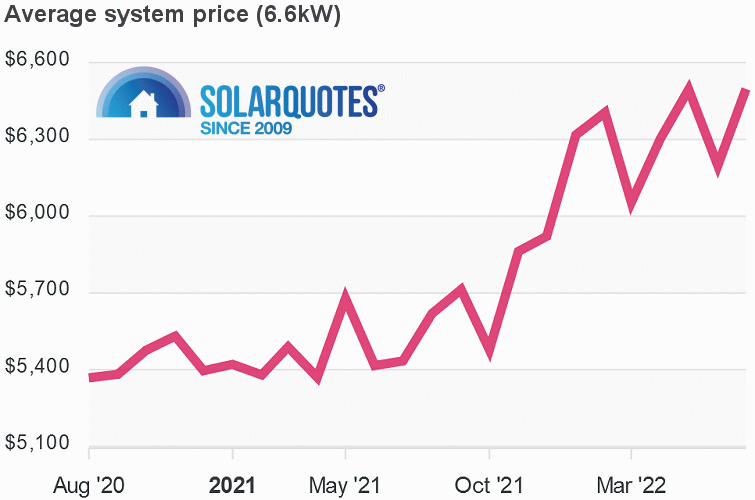
6.6kW Solar System Prices – July 2022
The graph below shows average pricing nationally for 6.6kW systems – again, after all subsidies and including installation. July’s average was $6,497, the second-highest result since August 2020.
To view historical pricing on other system sizes, or reports on various system capacities based on specific components, check out the SolarQuotes Australian Solar Price Index.
Pumped Up Electricity Prices Push People To Solar Power
While not the frenzy we saw just after electricity price increases were announced for much of Australia; elevated interest in getting solar panels installed remains. This is likely to continue as households start getting power bills with the increases factored in, and new increases come into play. It will be quite a nasty shock for some households given winter heating costs, and big bills in summer from air-conditioning aren’t really all that far off .
Good quality solar systems may be more expensive at the moment than a year ago, but generating electricity from your rooftop remains a solid investment. Putting off that decision only locks a household into higher electricity bills for longer.
There’s also continuing strong interest in home batteries currently. A recent survey indicated 84% of Australian solar owners without a home battery were interested in buying one in the next 3 years. But interest and action can be very different beasts, and the high cost of solar batteries remains a hurdle.
Whether you’re thinking of going solar, installing panels and a battery, or retrofitting a PV system with home energy storage, you need solid information on which to base a decision. You can find this information in SolarQuotes Founder Finn Peacock’s “101” guides to solar and batteries.


 RSS - Posts


Hi Michael,
Whilst an article on ‘average pricing’ is of some interest, without more data it gives the impression that any pricing above the ‘average’ is too high. The rooftop solar company I work for is a CEC retailer, has been in business a long time and is one who offers genuine long term after sales workmanship warranties. When solar systems develop issues but the installer is no longer in business or offers no after sales service, such systems often get removed. The vast majority of removals we see are less than 10 years old, yet properly installed , supported and higher quality systems last 25+ years. There have been many media presentations on the oh so many solar owners who have been caught out, including myself, buying cheaper systems with no after sales support. Government legislation and oversight of the industry is sadly lacking and whilst the CEC (and others) play a role, they clearly do not have the powers or staff to adequately protect consumers.
No one wants to pay too much, yet this data is guiding solar buyers on price alone. The return on solar investment has less to do with purchase price and much more to do with installation quality, after sales service and how long a system works. The cheap end of the solar industry pushes much harder into peoples homes with television advertising etc, bringing the average pricing down, along with the entire solar owning experience. A properly supported and installed system is not reflected by the average price. It would be more meaningful if such pricing data could be segregated and quantified, otherwise such information is potentially adding to the problems within the industry, rather than solving them.