The average cost per watt for solar power systems dropped in some Australian states and rose in others in March 2022. Here’s a look at what happened where.
Average installed cost per watt in March dropped by 4c in Queensland, 9c in the ACT, a whopping 17c in Victoria and 2c in South Australia. But in New South Wales, prices jumped 12c and Western Australia saw an increase of 6c – the latter due to higher average pricing for a handful of systems in the 6kW (not 6.6kW) category.
At the time of writing, here’s how March 2022 was shaping up compared to February, and compared to March in 2021.
| State | Cost per watt (March 2021) |
Cost per watt (February 2022) |
Cost per watt (March 2022) |
| QLD | $0.90 | $1.01 | $0.97 |
| NSW | $1.01 | $1.13 | $1.25 |
| ACT | $1.04 | $1.37 | $1.28 |
| VIC | $0.83 | $1.04 | $0.87 |
| TAS | $1.03 | NA | NA |
| SA | $0.85 | $1.04 | $1.02 |
| WA | $0.79 | $0.87 | $0.93 |
| NT | NA | NA | NA |
| AU | $0.92 | $1.04 | $1.02 |
These figures are generated by Solar Quotes’ Australian Solar Price Index, a tool providing historical pricing in each state and nationally. The Index also offers filters enabling generation of reports on various system capacities and components.
The averages for March 2022 are calculated based on details from 257 Australian system purchasers who shared with us what they paid when submitting solar installer reviews; including reviews of businesses not within the SQ installer network. The graphs are generated in real-time as new reviews come in, so the results for March (and other months) are subject to change.
More On Cost Per Watt
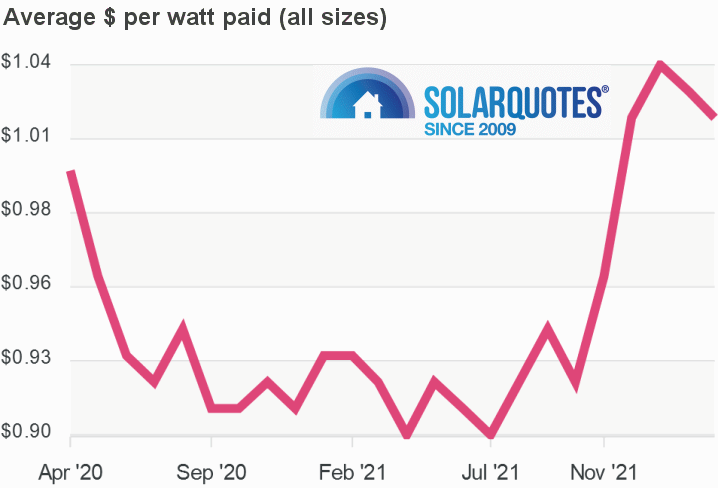
The following graph shows average cost-per-watt across all system sizes nationally going back to April 2020.
Looking at individual states, while Western Australia usually has the lowest system pricing – driven by fierce competition in the Perth metropolitan area – it was interesting Victoria appeared to have the cheapest solar in Australia in March 2022 on a cost-per-watt basis. This is the lowest cost we’ve seen in Victoria since July last year. While things can change month-to-month, now could be a particularly good time to take advantage of Victoria’s solar panel rebate.
6.6kW Solar System Pricing In March 2022
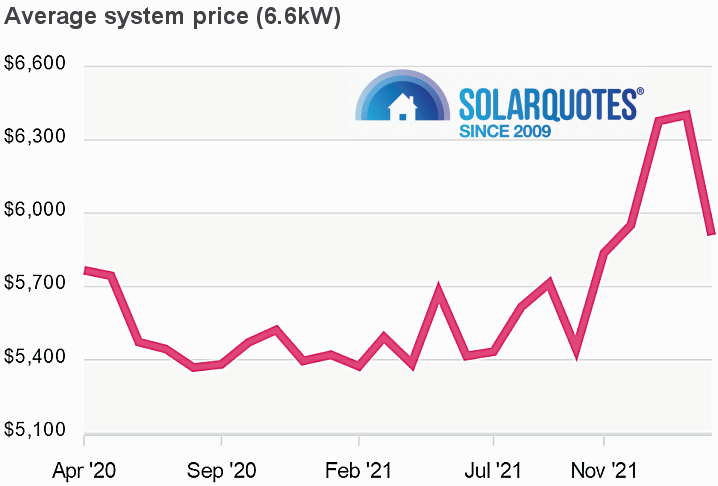
The following graph plots historical costs of fully installed 6.6kW solar systems across Australia over the same timeframe.
After a significant increase from December ($5,591) to January ($6,377) and then another small rise in February ($6,402), 6.6kW solar system pricing dropped back to an average $5,910 in March 2022. Again, Victoria led the way in terms of the biggest decrease – but there were also reductions in Queensland, Victoria, South Australia and Western Australia. The average 6.6kW price in New South Wales headed north again, and we don’t have enough data for ACT, TAS and the NT at this point to make a useful comparison.
Whether solar system prices are heading up or down, the best time to buy a solar power system is usually right now to avoid further locking in of high household power bills. And it looks like electricity bills could be higher for many Australians soon due to pressure on wholesale energy prices. For solar owners, the good news the situation could also mean higher feed in tariffs – but the focus these days should still be on self-consumption to maximise value.
To get an instant estimate on how much you could be saving on household energy bills by installing a solar power system, try SQ’s solar calculator. For an at-a-glance listing of pricing ranges for good quality systems of varying capacities, check out our solar panel costs page.


 RSS - Posts


Speak Your Mind