Some Christmas cooking, 19 visitors, an aging ducted reverse-cycle air-conditioner, a hot day and a rooftop solar power system. Find out how much Energy Australia made from us yesterday.
We were meant to spend yesterday at another family member’s house for a get-together with the clan, but on Xmas Eve my better half received a phone call from her brother:
“Hey sis, our air conditioner is kaput and the parts won’t be available until the New Year. Can we hold Xmas lunch over at your place?”
(or words to that effect).
And thus began a bit of schedule rejiggering to hold the blasted blessed event at our digs. My other half is very resourceful and flexible, so it hardly fazed her. As for me, it seemed the future of life on this planet as we know it was suddenly threatened. But I was curious to see how having all these heat-producing bodies in our space would affect our energy consumption; particularly given some would be entering and exiting the house frequently.
The Scenario
- 21 humans (including us) + a Jack Russell
- A 10-year-old, not-particularly-efficient ducted reverse-cycle air conditioner set to 25°C in 3 zones for nearly 9 hours. This was very luxurious for us, as it’s usually set at 2 zones and 26°C for far shorter periods on hot days.
- Brick veneer home, double glazed windows, plantation shutters and roof insulation.
- Some microwave, convection oven and air fryer cookery, along with sundry electrical appliances.
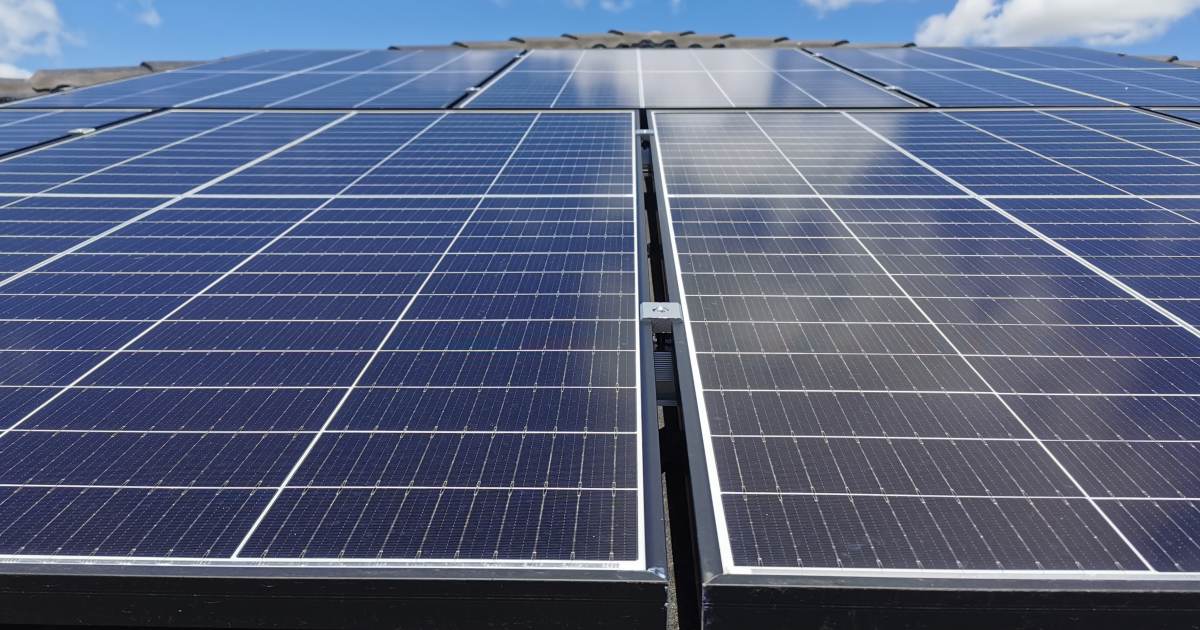
- 10 kW of Trina solar panels, an 8.2kW Fronius inverter and a Fronius Smart Meter.
- Solar system export limited to 5kW.
- Outside temperature reached 34°C, 30°C before 11 am.
- Fairly clear conditions for most of the day; a bit of scattered cloud in the morning if I remember correctly.
Here’s What Happened
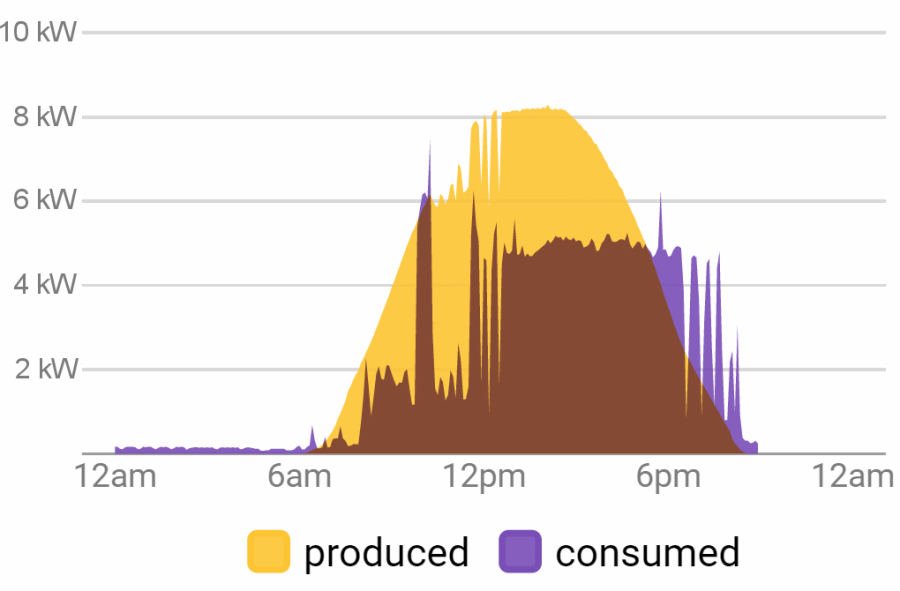
So, here’s how things went; using a slightly butchered graph generated by SolarAnalytics based on data from the Fronius Smart Meter.
Breaking it down a bit:
- There was some simultaneous convection oven, microwave and air-fryer usage around 9.50 am.
- Air-conditioner went on at 11.30 am. You can see it ramping up and down for the next hour.
- Folks started piling in at 12.30 pm, and external doors were opening (very regularly) and closing (with some reminders) from that point on.
- The inverter was clipping output solidly from 12.40 pm to 2.40 pm
- For whatever reason, the graph points cut out after 8.55 pm. Perhaps someone fell asleep at Fronius and it will update this morning. But between that time and midnight, there’s probably only around half a kilowatt-hour of usage.
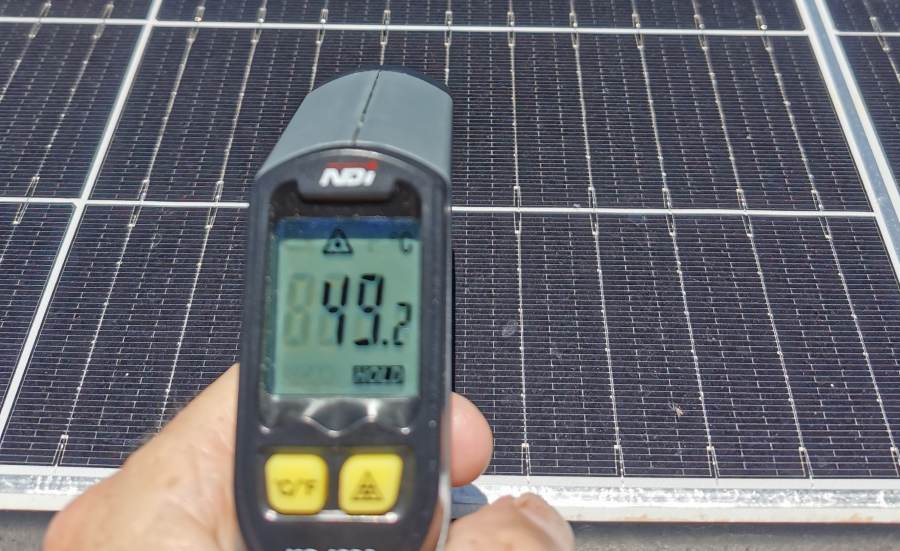
Being the life of the party that I am, I spent a lot of time watching system performance during the day. I also took a temperature reading of the panels at around 2 pm (excuse the image quality).
They were getting pretty warm as the sun beat down upon them. A couple of minutes before this photo was taken, the reading was 50.6°C.
The wattage rating of a solar panel is based on Standard Test Conditions (STC); one of which is 25°C. That’s module temperature, not ambient. Above 25°C and panels start to lose efficiency. That’s where an “oversized” system such as ours can be of some benefit.
Solar power covered everything from 6.55 am – aside from that reasonably brief consumption spike in the morning – until 5.15 pm. At that point I approached those who remained (18 of them!), pointed to the door and firmly declared:
“EVERYONE MUST LEAVE. NOW.”
Wasn’t this just meant to be lunch??? Anyway, they thought I was joking and totally ignored me. I didn’t chuck a hissy fit though as revenge is a dish best served cold. And speaking of cold, lunch extended into cold cuts for dinner for everyone. So much food!
The last of the visitors left at 8.17 pm and the air conditioner was switched off as the door closed for the last time of the day.
How Much Electricity Cost Us For Xmas
The total electricity cost for the day was an estimated $1.12, including Energy Australia’s daily usage charge. The solar panels saved us an estimated $18.55 yesterday, which includes exports + consumption. I’m pretty happy with that; although exports appeared to a bit lower during part of the morning than they should have been under the conditions – so I’ll be keeping a closer eye on that today.
Just on the consumption data – most solar inverters will show you energy production, but that’s only half the story. The Fronius Smart Meter enables us to also monitor electricity use in pretty much real-time via Fronius Solar.web, while Solar Analytics makes it all easier to see and to get a better read on the financial side of things.
Consumption monitoring, aka advanced solar monitoring, is an optional extra with a solar power system; but one well worth having to get the full picture of what your system and home is doing.
A Very Solar Christmas In South Australia
SA’s solar energy Santa brought big savings to hundreds of thousands of the state’s solar households on the day, while helping to rein in wholesale electricity prices for everyone. In fact, spot prices on the wholesale market in SA were in negative territory from around 7 am to 3 pm. This is nothing new, sustained negative pricing events have been going on for some time here (and elsewhere).
According to OpenNEM, rooftop solar systems across the state contributed more than 70% of SA’s electricity demand between 10.30 am and 3 pm; peaking at 78.4% at 1 pm. There were also a couple of days in the lead-up when that reached over 80% – the best was 83.9% at 1 pm on Christmas Eve.
If you don’t have panels on your rooftop yet, make it one of your New Year’s resolutions to join millions of other Australians and get solar installed early in 2023. The longer you put it off, the longer you’re locking yourself into electricity bills much higher than they would otherwise be.


 RSS - Posts


In South Queensland we not only had negative feed in for most of the day, we also had 30 minutes of 0¢/ kW general price whilst coming the Christmas lunch.
Solar power is great in warmer weather, but I can’t help wonder how people in the USA are coping now – snow ‘bomb’ -26°C temperatures,
and millions without grid power – even with solar battery backup, it would be deadly cold. A combination of wind and solar would seem to be more reliable in winter, and hot summer Aussie nights if the grid is stretched.
Thanks for the info, I had a 10.73kw system installed in September 2020 after getting an installer from your site, although I don’t have a consumption meter,I still know roughly how well I’m doing as I haven’t paid a cent since then and I am in considerable credit. My estimated return on investment of 3.8 years I believe has been smashed as I decided to use air con instead of gas for heating during this time. (Gas bills in winter went from $500 to $80 as we still have gas instantaneous hot water). Overall extremely happy.
Side note: A week ago my daily generation topped out at 74 kWh for the day and 71 yesterday. ?
“Can I have some Xmas Pudding Uncle Mike ?”
“You can but not for another half hour until these clouds have passed…”
Not sure I understand that graph in the article.
For example, at 3pm it says Produced 8KW and Consumed 5KW. So you are exporting 3 KW? Why is the consumed so flat at 5KW through the day?
You note that export limit is 5KW so I presume it’s just a coincidence?
The consumption is flat at 5kw because the ac compressor never cycled on and off