Solar panel image: B137,CC BY-SA 4.0
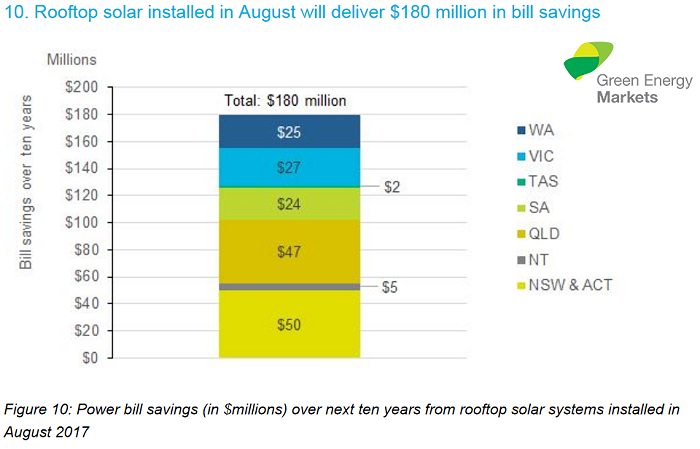
The latest Renewable Energy Index from Green Markets indicates rooftop solar panels (small scale systems) installed across Australia last month will deliver $180 million in electricity bill savings over 10 years.
The biggest winners will be New South Wales and ACT owners, who will collectively save an estimated $50 million over the next decade, followed by Queenslanders at $47 million.
Green Markets reports 15,225 small-scale rooftop solar power systems were installed throughout the country last month, representing enough capacity to generate energy equivalent to the needs of 25,559 homes1. Queensland led in this, with the equivalent of 7,046 homes.
Of the small scale PV systems installed in August, New South Wales and the ACT led the way with 4,111 installations combined, followed by Queensland (3,999), Western Australia (2,714), Victoria (2,643), South Australia (1,351), Tasmania (210) and Northern Territory (197).
Small-scale solar continues to be a significant employer, with installation of August’s systems supporting 4,893 full-time equivalent jobs across installation, design and sales.
Looking at the bigger renewable energy picture in Australia, August saw the nation generate renewables-based electricity equal to the power consumption of 8.2 million homes, or three quarters of all households in the country.
“Renewables made up 19.5% of the electricity generated in August across the east and west coast main electricity grids. The amount of renewable energy used in August avoided an amount of carbon pollution equal to removing 9 million cars from the road – equal to two-thirds of all the cars in Australia,” states Green Energy Markets.
On the large-scale side of things, the report states 56 major renewable energy projects were under construction at the end of last month, with these projects estimated to generate enough jobs to employ 11,941 people full-time for a year – this was up 2,044 on the previous month. Queensland breezed past New South Wales for renewable energy jobs related to large-scale projects for the first time.
Now a monthly publication, Green Energy Markets’ Renewable Energy Index keeps tabs on the amount of renewable energy in Australia, the jobs renewables are creating, the energy bill savings it is delivering to Australian households, and the environmental benefits.
The August 2017 Renewable Energy Index can be downloaded here (PDF).
Footnotes
- Refer to the report for Green Markets’ methodology ↩


 RSS - Posts


Please can these reports include per capita quantities?
Numbers such as in the paragraph
”
Of the small scale PV systems installed in August, New South Wales and the ACT led the way with 4,111 installations combined, followed by Queensland (3,999), Western Australia (2,714), Victoria (2,643), South Australia (1,351), Tasmania (210) and Northern Territory (197).
”
are much more meaningful and valuable, if they are given as quantities per thousand head of population.
Regarding my previous post, publishing the numbers in terms of per thousand head of population, would also more truthfully represent the information.
With
“New South Wales and the ACT led the way with 4,111 installations combined,”
and
“Western Australia (2,714)”
is it then true, that the combined population of NSW and the ACT, is less than (4111/2714 =) 1,51 times the population of WA?
Regarding the above most recent post by me, I believe that a good analogy, is thus;
If South Australia has a population of 1 million, and all of those people have an IQ of 100, and New South Wales has a population of 4 million, and all of those people have an IQ of 30, are the people of New South Wales, more intelligent than the people of South Australia, due to the sum of the IQ’s of each respective state, being 120 million and 100 million, respectively?