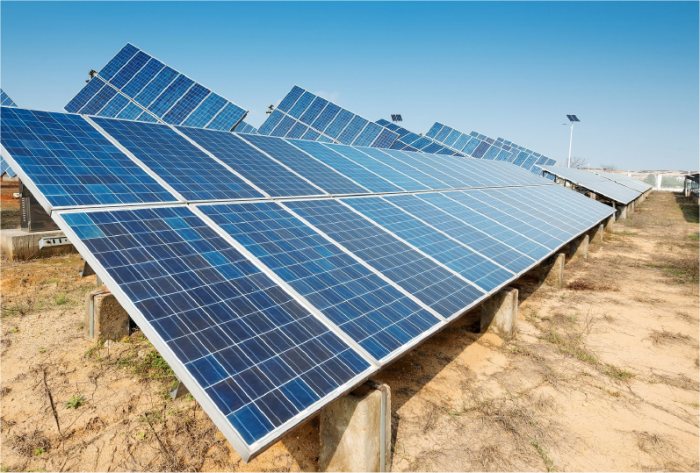
Image: Global Trends in Renewable Energy Investment 2018
Renewable energy investment in Australia jumped 147% last year to a record USD $8.5 billion (around AUD $11 billion at current exchange rates) – and solar power accounted for more than half that figure.
The Global Trends in Renewable Energy Investment 2018 report was released last Thursday by the UN Environment Programme (UNEP). It states a record 157 gigawatts of renewable energy capacity (excluding large hydro) was commissioned globally last year, with solar energy alone accounting for 98GW. This was more than the net additions of coal, gas and nuclear plants combined.
Solar energy accounted for 38% of net new power capacity brought online globally during 2017.
“The extraordinary surge in solar investment shows how the global energy map is changing and, more importantly, what the economic benefits are of such a shift,” said UNEP chief Erik Solheim.
Australia A Standout Performer
The report noted the sharp increase in investment in Australia, with solar power making up USD $4.9 billion and wind comprising $3.6 billion of the $8.5 billion total. 2017 also saw Australia enter the top ten list for renewable energy asset finance for the first time.
Commenting on the report, Climate Council Acting CEO Dr Martin Rice said:
“If Australia maintains this momentum then we could see the phasing out of coal within the next two decades, transitioning the nation to an energy grid fit for the 21st century and one that slashes our rising greenhouse gas pollution levels.”
That assessment is unlikely to be well received by the Monash Forum, who are calling for the construction of “Hazelwood 2.0”, funded by taxpayers.
Australian Small Scale Solar Prices Plummet
The UNEP report makes special mention of how much small- scale solar prices dropped in Australia over the previous 7 years.
“A 4kW PV system cost an average of $6.40 per Watt in 2010, yet by the end of 2017 it had plummeted 78% to just $1.40 per Watt,” it states.
To put that in Australian currency at current exchange rates, that’s a drop from $8.40 to $1.82 per watt and doesn’t take into account the “solar rebate“. With the subsidy, the nationally averaged price of a 4kW solar power system (installed) is currently around the $5,500 mark.
While not the world leader for installed residential and commercial solar PV systems, Australia was no slouch on this front in 2017.
Japan was estimated to have 36GW of installed residential and commercial PV capacity by the end of last year, followed by Germany (30GW), USA (18GW), China (17GW) Italy (15GW). Australia trailed the major nations with 6GW of installed capacity.
The full Global Trends in Renewable Energy Investment 2018 report can be downloaded here (PDF).

 RSS - Posts


But is it correct that “Australia trailed the major nations”, on a per 100,000 population basis?
Comparisons, such as these, where, for example, the USA has (I think) about fifteen times the population of Australia,, should be on a quantum (I use 100,000) of population, basis.
It completely changes the comparisons.
Yep, I think China’s population is more than 3 times ours…
Actually I had a quick look at the population of the 5 nations mentioned (via Wikipedia, which should work for a rough estimate) and worked out a quick per capita number:
Germany: 32 GW / 82 million = 0.37 GW/million
Italy: 15 GW / 59 million = 0.25 GW/million
Australia: 6 GW / 24 million = 0.25 GW/million
USA: 18 GW / 322 million = 0.06 GW/million
China: 17 GW / 1403 million = 0.01 GW / million
On those numbers we are on par with Italy (allowing for some rounding errors) and a bit behind Germany but way, way ahead of the USA and China.
And… I bet if you consider the capacity factor for Australian PV vs German PV (or look at GWh rather than GW, i.e. annual energy rather than peak power) I bet we’re even more competitive with Germany!
Oi Oi Oi!