What are the latest solar and battery customer trends? The auSSII report puts its magnifying glass over the month of April to see what mattered most to Australians in the market for renewable energy products.
PV System Sizes
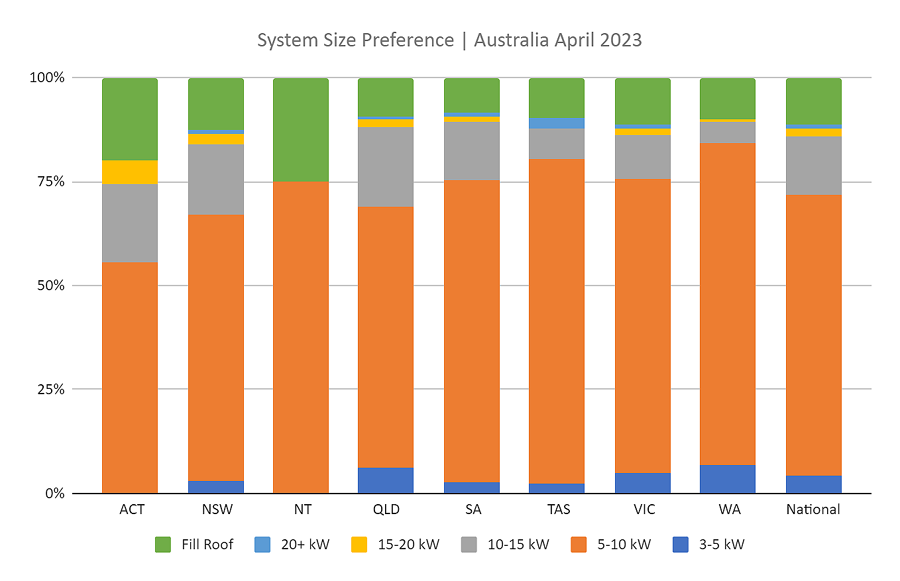
PV (photovoltaic) system buyers weren’t in the mood for change this month. Inquiries for capacity options of 3-5 kW, 5-10 kW, 10-15 kW, 15-20 kW, 20+ kW, and “Fill Roof” on SQ’s quoting form remained almost identical to the previous month. 5-10 KW is still the biggest seller at 67%, although trending downwards. (March 68%, February 75%, January 74%). The category of 10-15 kW picked up these losses with just over 14%.
If you’re in the dark about how much solar you need I recommend reading SolarQuotes Founder Finn’s advice on solar power system sizing.
Intended Purchasing Timeframe
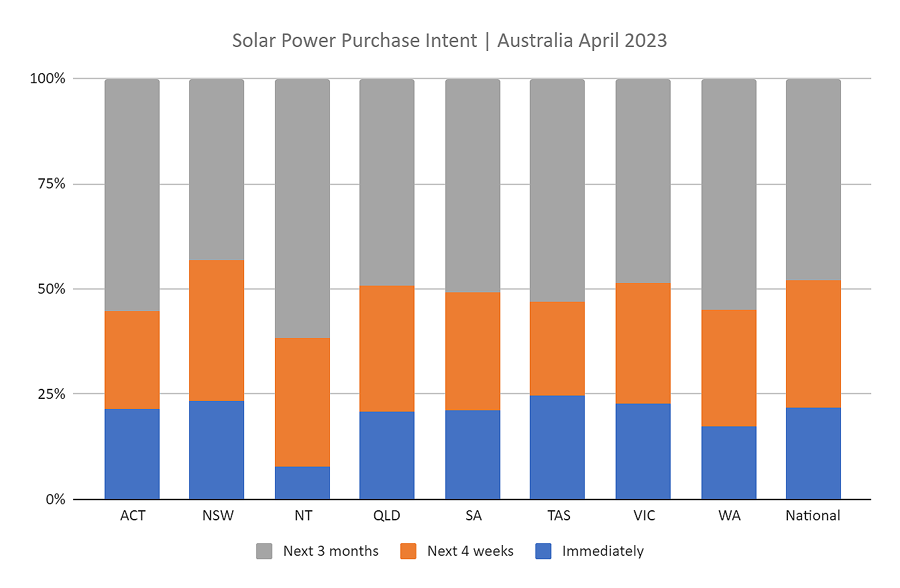
Interest in installing rooftop solar systems “immediately” picked up a tiny bit since the previous month. Given the options of “immediately”, “next 4 weeks”, and “next 3 months”, the latter is most common. Savvy buyers like to do their homework.
- Immediately: 22% (March 20.6%, February 21.7%, January 22.5%)
- Next 4 weeks: 30.1% (March 31.7%, February 31.6%, January 29.1%)
- Next 3 months: 47.9% (March 47.7%, February 46.7%, January 48.3%)
Australia’s solar rebate is still very generous, but losing its shine by the minute. It won’t be around forever, so never do tomorrow what you can do today!
Price Compared To Quality
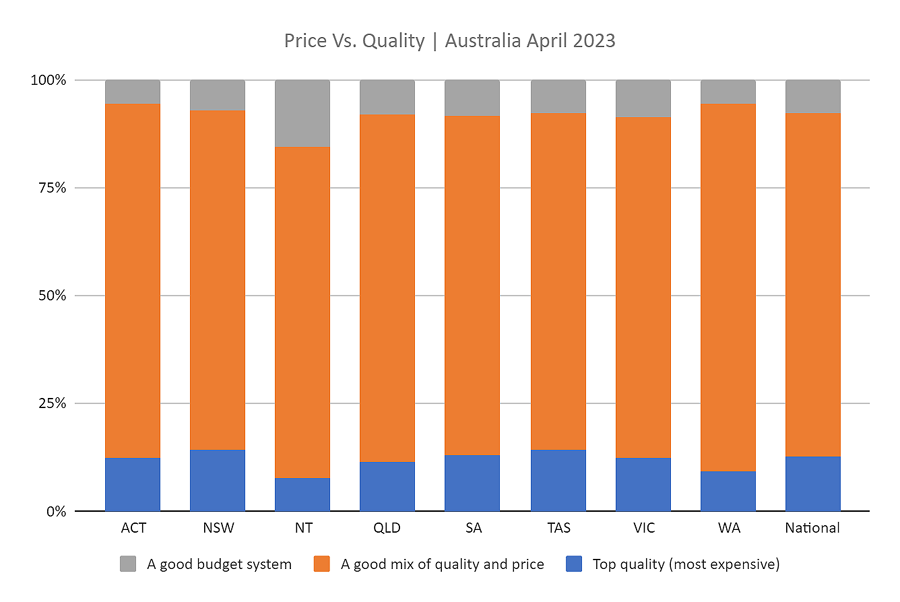
It’s groundhog day for buyers when asked what they wanted concerning price compared to quality. These stats are almost identical to last month with customers wanting it all:
- A good budget system: 7.6% (March 7.6%, February 7.8%, January 7.3%)
- A good mix of quality and price: 79.7% (March 81%, February 81%, January 81.3%)
- Top quality (most expensive): 12.7% (March 11.4%, February 11.2%, January 11.4%)
Check out current pricing ranges on SolarQuotes Solar Panels Costs page, and for a more historical and in-depth look use the Solar Price Index.
Will That Be Cash?
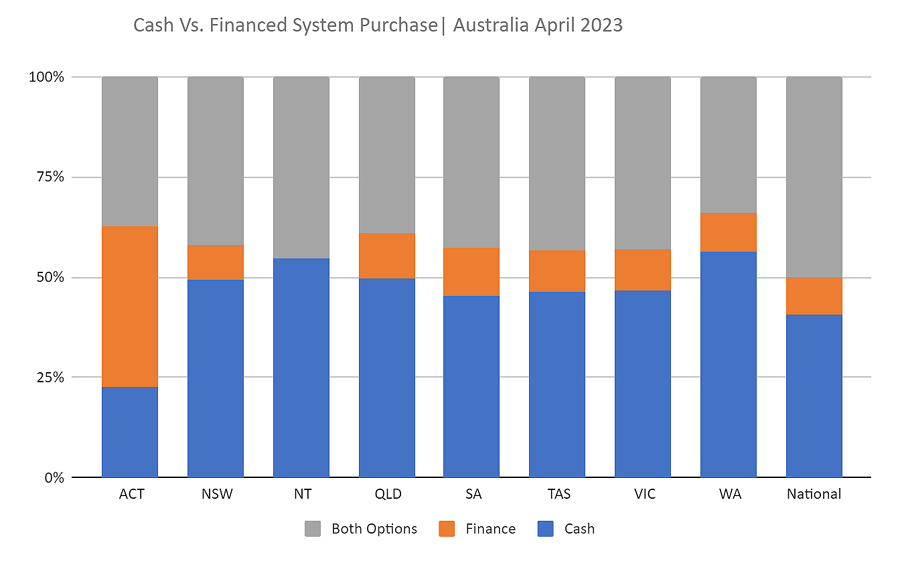
The trend continues this month for cash buyers of rooftop solar. 40.8% preferred to pay upfront, which is up again from last month. 9.2% would finance, and again 50% wanted both options. Here are the previous 3 months stats:
- Cash: (March 39.8%, February 38.9%, January 40.6%)
- Finance: (March 10.2%, February 11.1%, January 9.4%)
- Both options: (March 50%, February 50%, January 50%)
Ensure you thoroughly research solar finance options before signing on the dotted line, and this includes so-called “0% interest” Buy Now, Pay Later (BNPL) arrangements.
Module Level Power Electronics (MLPE)
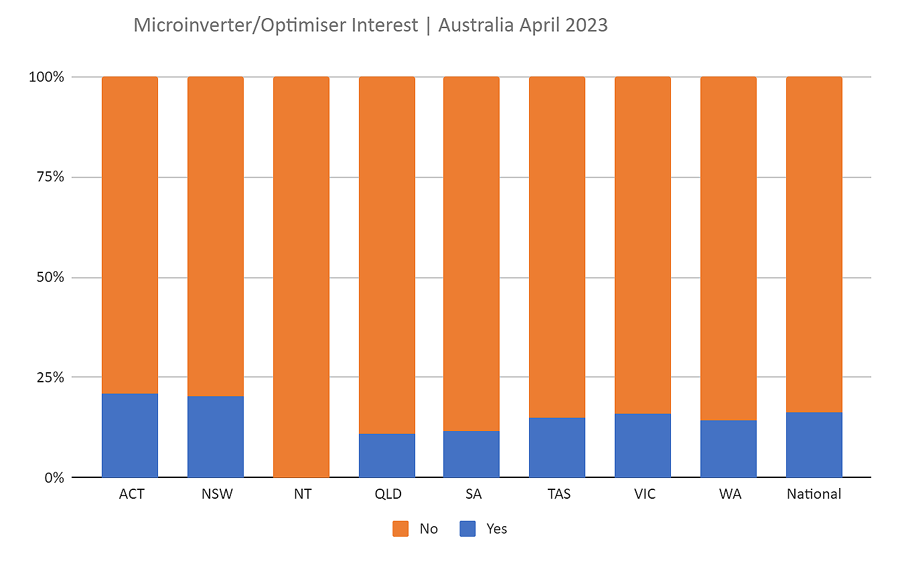
More quote submissions piquing interest in microinverters and optimisers aka module-level power electronics (MLPE) this month. 16.2% for a yes (March 15.9%, February 15.7%, January 15.9%), and 83.8% no thanks (March 84.1%, February 84.3%, January 84.1%) .
Electricity Consumption Monitoring
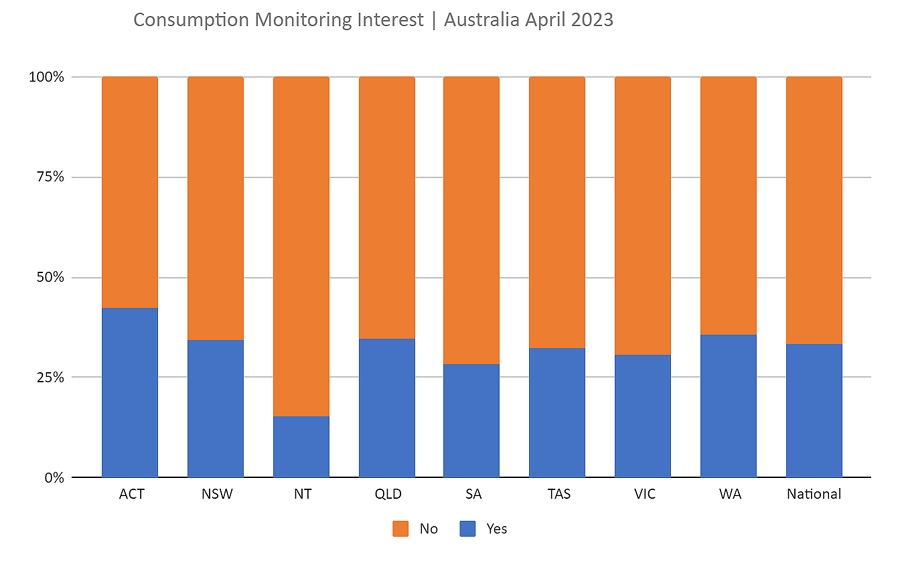
For some reason the punters don’t see this valuable so-called optional extra as worthwhile. 33.2% for a yes (March 35.4%, February 34.5%, January 36.3%), and 66.8% for no thanks I’m good (March 64.6%, February 65.5%, January 63.7%). I’m scratching my head because it’s common knowledge that consumption monitoring is money well spent to likely reduce the payback time for a rooftop solar system.
Battery Ready Integration
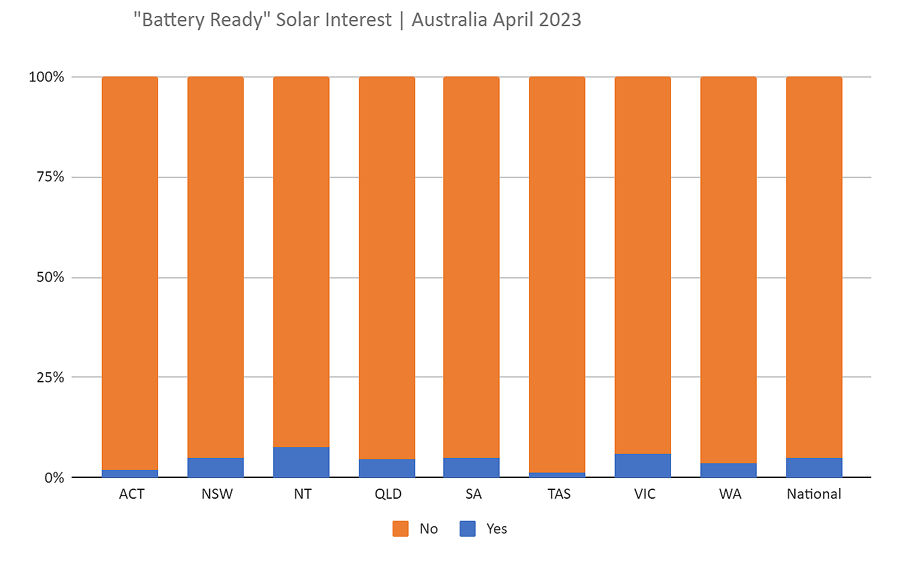
Interest in battery readiness remained low at 4.9% again (March 4.9%, February 4.7%, January 5.1%). Batteries can be retrofitted in most cases, but it’s recommended to have the conversation at the start when installing solar, so as to achieve the best possible design to accommodate future batteries.
Solar + Battery Interest
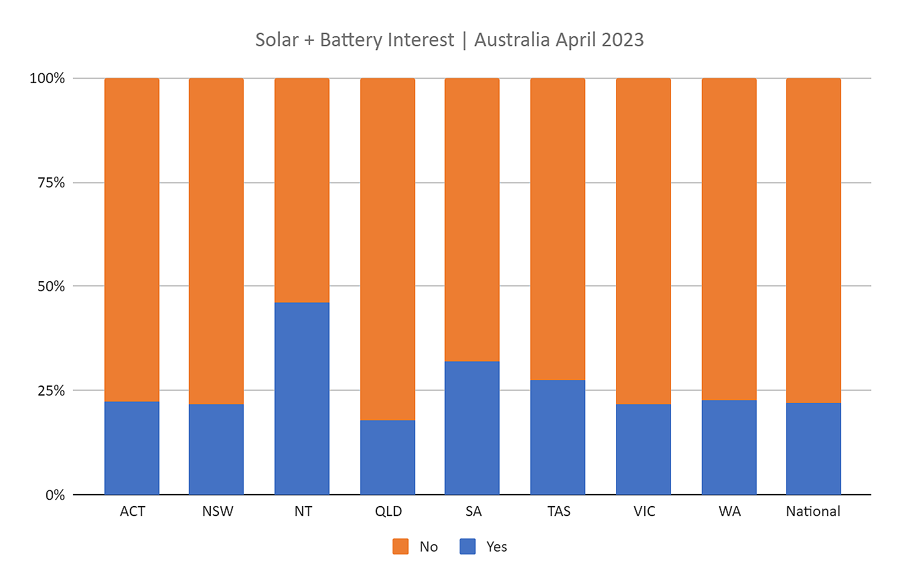
In April, approximately 21.1% of Australian solar customers showed interest in installing a home battery alongside their panels, which is a jump compared to the previous 3 months – (March 18.5%, February 17.8%, January 18%).
The above numbers indicate that investing in a solar battery is not a priority for most buyers at the moment. However the writing on the wall says that it will be soon, so now is a good time to learn about the common mistakes that home battery buyers often make.
Reasoning For Battery Purchase
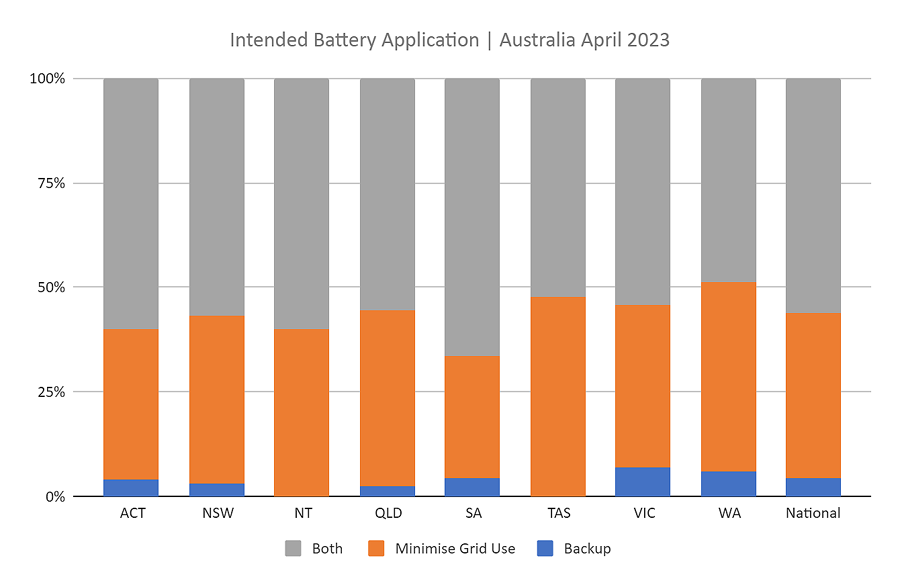
The main reasons noted in March for buying a battery were:
- Backup: 4.4% (March 4.6%, February 5.1%, January 5%)
- Minimising grid electricity use: 39.5% (March 34.4%, February 33.5%, January38.5 %)
- Both purposes: 56.1% (March 61%, February 61.4%, January 56.5%)
Pre-Solar Install Power Bills
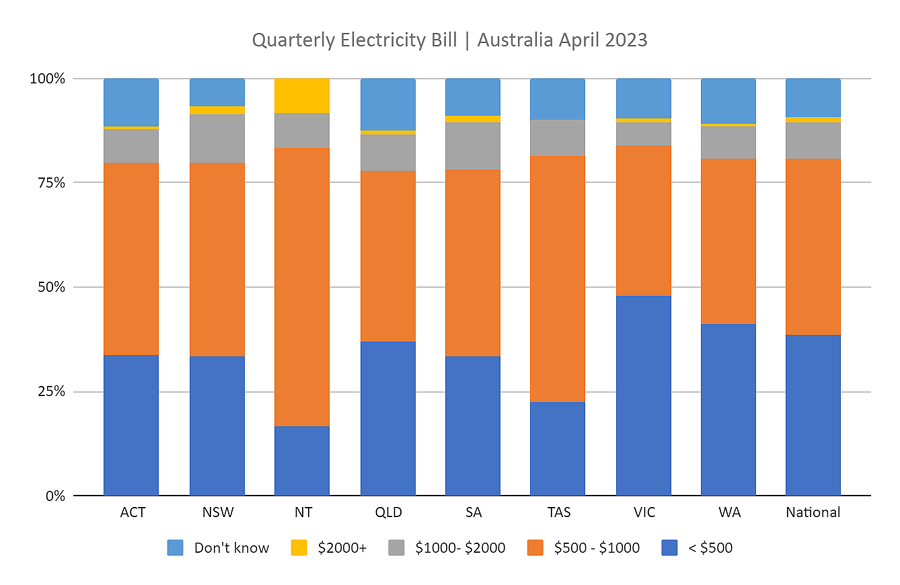
Where pre-solar power bills were provided, this was the breakdown:
- <$500: 38.7% (March 38.1%, February 38.6%, January 35.4%)
- $500-$1000: 42% (March 42.8%, February 41.5%, January 43.8%)
- $1000-$2000: 8.8% (March 9.5%, February 9.7%, January 9.7%)
- +$2000: 1.3% (March 1.2%, February 1.3%, January 1.4%)
- Don’t know: 9.2% (March 8.5%, February 8.9%, January 9.7%)
About The auSSII (Australian Solar Systems Interest Index)
Thousands of Australians request quotes from SolarQuotes’ network of carefully pre-vetted installers each month. The auSSII Report is collated using the data they provide.
Quality Solar Installers Wanted
If your business strongly focuses on providing quality installations and reasonable prices, then SolarQuotes can connect you to eager Australian buyers. Learn more about acquiring sales leads via SolarQuotes.

 RSS - Posts


Alarming that such a significant portion of the market still driven by price or a price/quality mix. Products such as Huawei’s inverters do offer a great price, but at what cost. They offer lower cyber security.