The Department of Industry, Science, Energy and Resources has released electricity generation statistics covering last year in Australia that show solar energy’s continued ascent and coal power’s ongoing decline.
The statistics cover all electricity generation in Australia, including home solar and commercial/utility-scale PV.
In 2019, fossil fuel sources accounted for 209,636 GWh of total electricity generation – a decrease of 2% compared with 2018. Coal still made up the majority of electricity generation, estimated at 56% of Australia’s total electricity generation last year (60% in 2018).
The largest source of renewables-based generation was wind energy (7% of total generation) followed by solar power (7%) and hydro (5%).
Here’s a quick look at how things sat nationally and state-by-state in 2019, based on fact sheets provided by the Department. Note that these are estimates, with the full Australian Energy Statistics report to be published later in the year
National:
- 265,117 GWh of electricity generated (+1%)
- 21% renewables share
- 56% coal share
- 21% gas share
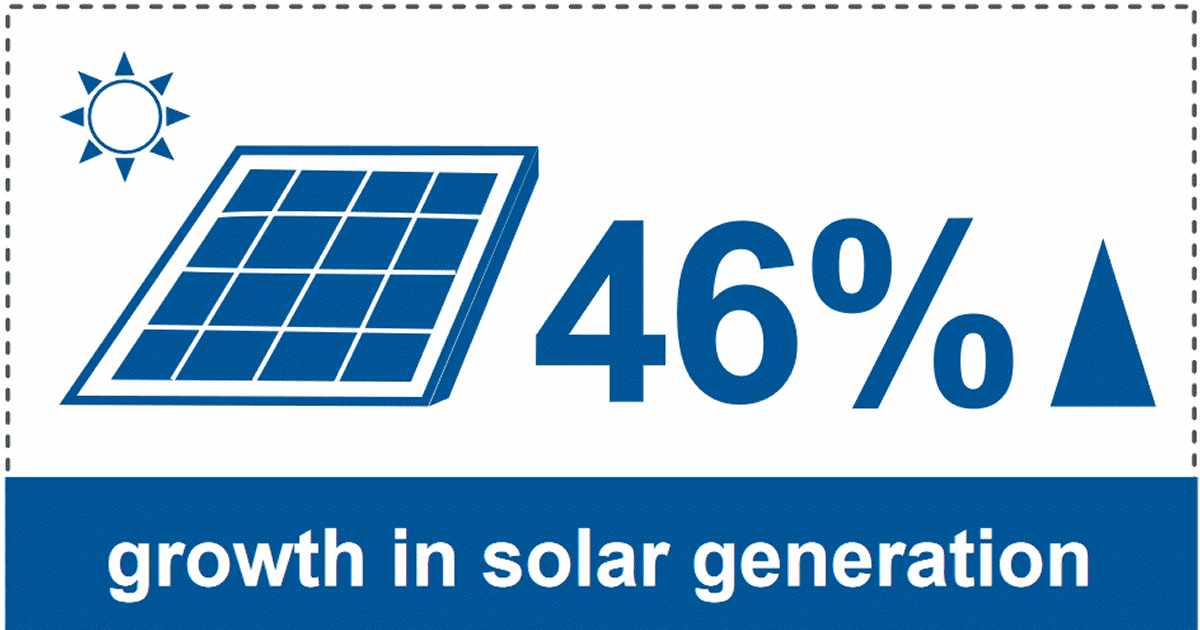
- 46% growth in solar energy generation
New South Wales:
- 73,532 GWh of electricity generated (+1%)
- 19% renewables share
- 77% coal share
- 39% growth in solar generation
- Gas generation grew 31% over 2018
Victoria
- 47,235 GWh of electricity generated (down 1%)
- 21% renewables share
- 70% coal share
- 56% growth in solar energy generation
- Gas generation growth of 31% over 2018
Queensland
- 70,964 GWh of electricity generated (no change)
- 13% renewables share
- 70% coal share
- 15% gas share
- 62% growth in solar energy generation
Western Australia
- 42,709 GWh of electricity generated (+2%)
- 10% renewables share
- 61% natural gas share
- 33% growth in wind generation
The fact sheet for Western Australia missed out on solar energy generation statistics, but the supplied spreadsheet indicates growth of around 26%.
South Australia
- 15,400 GWh of electricity generated (+9%)
- 50% renewables share
- 49% natural gas share
- 36% growth in solar energy generation
Tasmania
- 10,801 GWh of electricity generated (-12%)
- 94% renewables share
- 81% hydro share
- 10% growth in wind generation
Again, solar energy generation wasn’t mentioned in Tasmania’s fact sheet, but the spreadsheet shows growth of approximately 15% – and all of that from small-scale systems.
Northern Territory
- 4,478 GWh of electricity generated (+12%)
- 4% renewables share
- 58% natural gas share
- 32% growth in solar energy generation
The ACT isn’t noted in the stats – perhaps it’s combined with NSW.
Small Scale Solar Power Shines
Here’s a look at the growth in small-scale solar power system (>100kW capacity) contributions over the last few years nationally:
- 2015 – 5,923 GWh
- 2016 – 6,880.9 GWh
- 2017 – 8,132 GWh
- 2018 – 9,940.5 GWh
- 2019 (estimated) – 12,455.3 GWh
…so, growth of around 25% in small-scale solar energy generation in 2019 over 2018 and approximately 110% over 2015.
With regard to large-scale solar power, generation grew from 2,338.7 GWh in 2018 to an estimated 5,495.4 GWh in 2019 (+135%).
If you’re interested in taking a deeper dive for each state or nationally, further information can be found here.

 RSS - Posts


1. In your state by state table you have WA renewables at 10 percent, but in the Clean Energy Australia it has WA renewables at 20.9 percent. There is no explanation – is the former GWH and the latter generative capacity?
2. On a national basis, what is the percentage share of solar and wind (ie excluding hydro and biomass) capacity and actual GWH contribution?