Image: MonikaP
Australia’s Clean Energy Regulator published the annual National Greenhouse and Energy Reporting data for 2016–17 late yesterday. While there was a reduction in emissions from electricity generation reported, the sector still accounted for more than half of all scope 1 emissions.
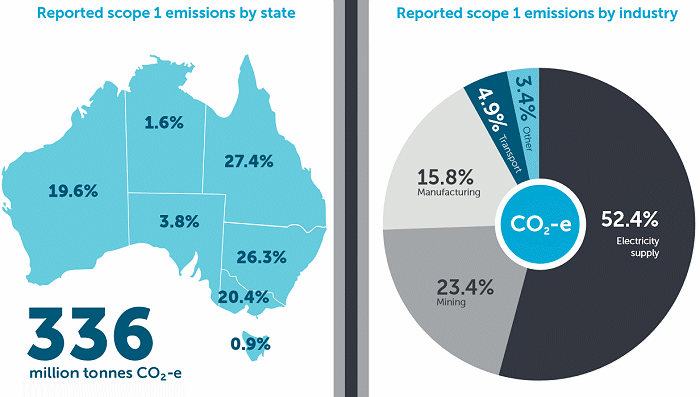
In 2016–17, total reported scope 11 emissions from grid-connected electricity generators reached 176 million tonnes of carbon dioxide equivalent (CO2-e), 54% of the 336 million tonnes of the scope 1 national total.
The 176 million tonnes was a decrease of 5 million tonnes, with the reduction attributed to reduced electricity generation from brown coal and the closure of the Hazelwood power station, plus improved efficiency from some black coal fired power stations and increased production from renewable energy sources.
After electricity generation, the next largest contributors to total scope 1 emissions were the manufacturing sectors (15.8 per cent collectively) and the coal mining sector (10 percent). All mining sectors represented 23.4% of the total.

Image: Clean Energy Regulator
Australia’s Worst Emitters
For the period, Australia’s highest corporate scope 1 emitters (all sectors) were:
- AGL Energy Ltd – 43.4 million tonnes
- Energy Australia Holdings Ltd – 21.7 million tonnes
- Stanwell Corporation Limited – 18.6 million tonnes
- Origin Energy Limited – 17.2 million tonnes
- CS Energy Ltd – 14.1 million tonnes
- International Power (Australia) Holdings Pty Ltd – 11.4 million tonnes
- Ozgen Holdings Australia Pty Ltd – 10.3 million tonnes
- Woodside Petroleum Ltd – 10.2 million tonnes
- Loy Yang Holdings Pty Ltd – 10.1 million tonnes
- Glencore Holdings Pty Ltd – 9.7 million
These ten corporations represented 49.7% of all scope 1 emissions in Australia in 2016-17.
Highest Emitters – Power Stations
Loy Yang Power Station and Mine (combined) generated the most scope 1 emissions during the reporting period (18,710,989 tonnes CO2-e/ 15,885,288 MWh electricity production), followed by Yallourn Power Station (14,813,624 tonnes CO2e / 11,473,837 MWh electricity production) and Bayswater (14,148,670 tonnes CO2-e / 15,944,580 MWh electricity production).
Loy Yang and Yallourn are brown coal-fired, while Bayswater uses black coal. AGL announced yesterday that a $200 million upgrade will occur at Bayswater to boost capacity without increasing emissions from the plant
Overall, Australia’s Emissions Rose – Again
The 336 million tonnes of scope 1 CO2-e emissions was an increase of 1.8 million tonnes (or 0.5 per cent) on 2015–16 levels, which was the lowest year-on-year growth in the last three years. The Regulator states the increase was largely due to activities in the liquefied natural gas (LNG) sector and oil and gas production sector emissions.
The Climate Council’s Professor Will Steffen was far from impressed.
“This is an abject failure and Australia can do better than this. We are now becoming complacent, as the nation’s greenhouse gas pollution levels consistently rise, every quarter since March 2013,” he said. “We must continue the transition to clean, affordable and reliable renewable energy and storage technologies through strong and credible climate and energy policy.”
Further information: 2016–17 National Greenhouse and Energy Reporting data highlights.
Footnotes
- Scope 1 emissions, or direct emissions, are those released into the atmosphere directly resulting from an activity, or series of activities at a facility level. ↩

 RSS - Posts


Speak Your Mind