August saw a significant increase in the proportion of Australians wanting to install battery-ready PV systems according to the latest SolarQuotes Australian Solar System Interest Index (auSSII) report.
The following are some highlights relating to interest in small-scale solar power systems in Australia last month.
Where Was The Interest?
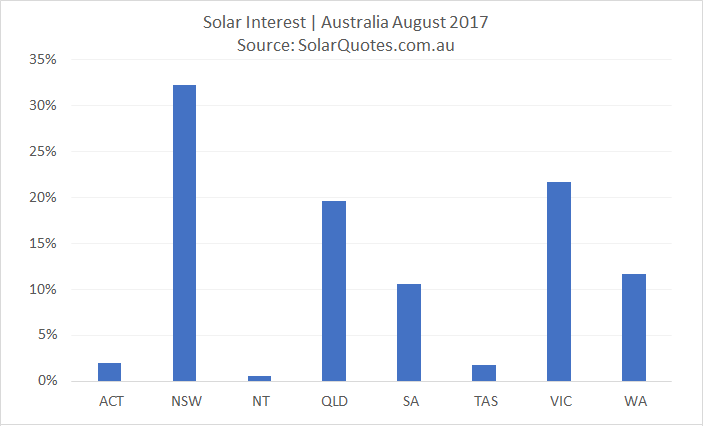
Solar Quotes saw an increase in quoting activity during August, with most of the interest again in New South Wales (~32% vs 34% in July), but note that numbers aren’t adjusted for population. Victoria and Queensland were again second and third, comprising 22% and 20% of all solar quotes respectively and maintaining their previous positions, but with significantly higher numbers. South Australia’s share also climbed, Western Australia and the Northern Territory’s proportions were reasonably static and we saw a drop in the ACT and Tasmania’s share.
PV System Size Preference
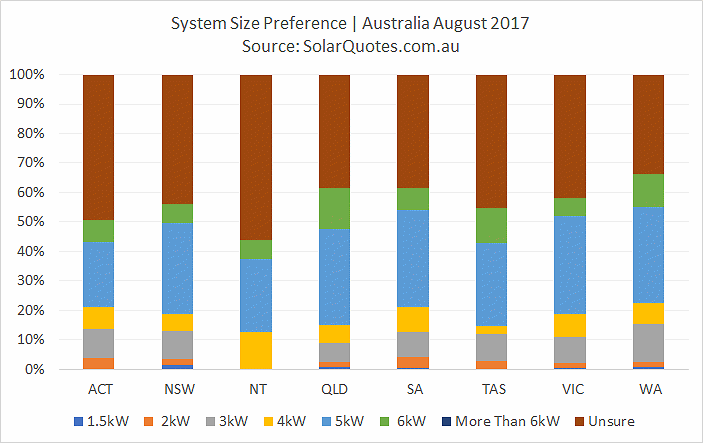
Big systems continue to rein supreme among Australians who selected a desired capacity during the quoting process, with requests for prices of 5kW+ solar packages making up nearly 70% of the total nationally. Similar to our report last month, 41% of those submitting for quotes were unsure on system capacity and requested advice.
System Purchase Intent
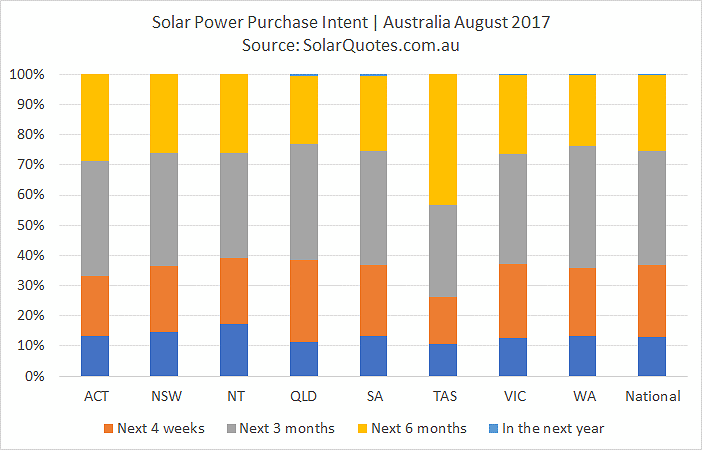
Australians are still keen on getting solar panels onto their rooftops sooner rather than later. Increases in feed in tariffs coupled with recent electricity price rises may be playing a role, which are making the economic case for solar even stronger; even taking into account the decrease in STC values. August saw 74% expressing an intention of installing within three months, similar to July. 37% indicated a purchase intent of within 4 weeks.
Battery-Ready System Requests
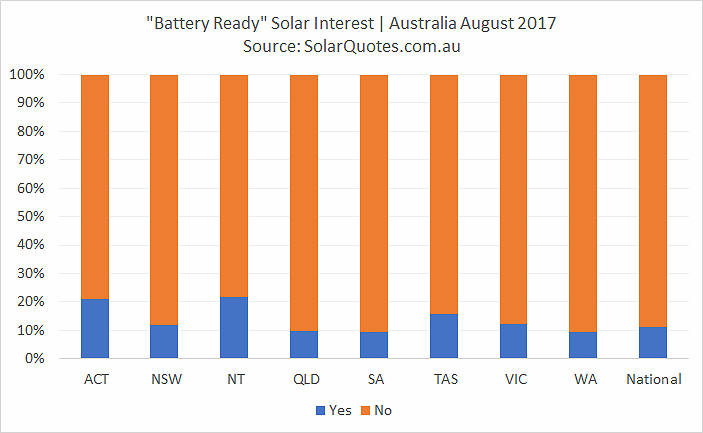
Interest in battery-ready solar power systems crept up significantly, with 12.5% indicating this preference during August (up from 10% in July).
Solar + Energy Storage Interest
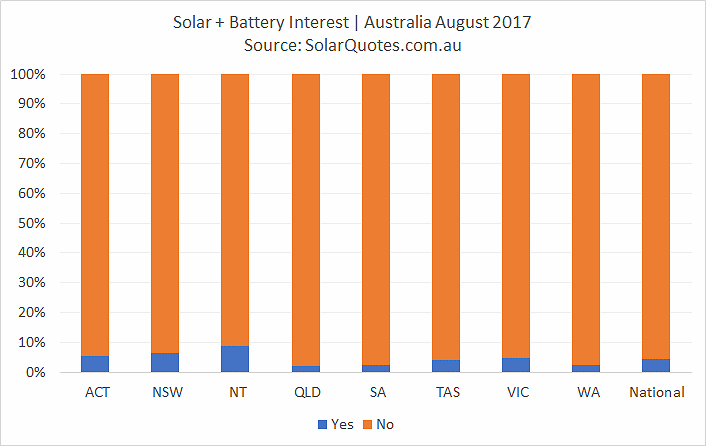
We saw some backing off on interest in installing solar power + energy storage concurrently. In July we recorded 6% wanting solar + battery quotes and in August, this dropped back to under 5%. Given the uptick in battery-ready system requests, this may indicate not so much a decline in interest in storage, but more Australians taking a wait-and-see approach.
Note: during our solar quoting process, we display a flag when PV + batteries are selected indicating approximate cost before the submitter can proceed. This is to help ensure the enquirer is seriously interested in solar + storage. A “battery-ready” system option is also offered at this point as an alternative.
Battery Capacity
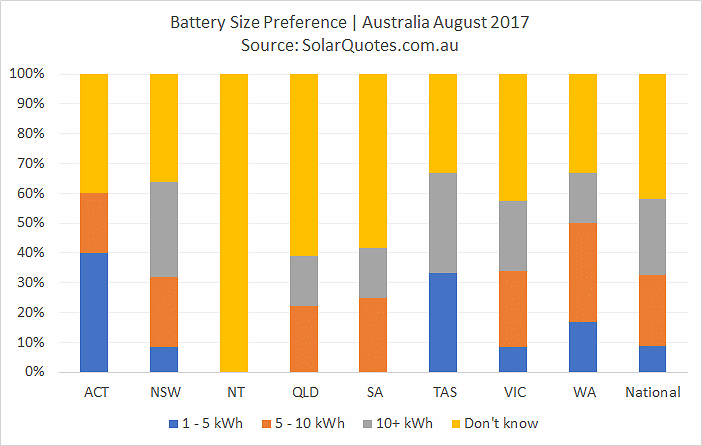
As with solar panel systems, Australians are wanting large storage capacity. The most popular size recorded during August was for 10kwh+ battery systems, comprising nearly 44% where a capacity was indicated.
Battery Storage Application
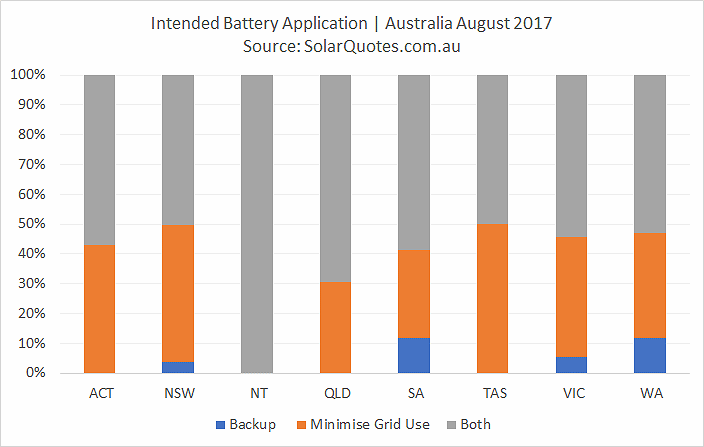
Close to 55% of Australians requesting battery quotes intend using it for both backup and minimising grid power consumption purposes – that’s up around 10% on July.
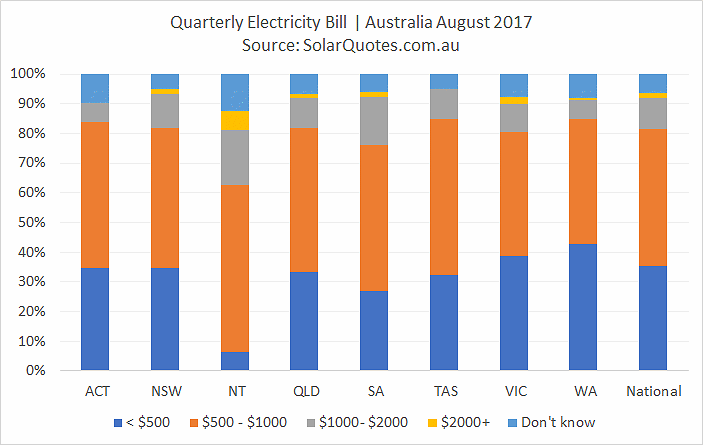
Electricity Bills
As was the case in July, 46% of Australians indicated they were paying between $500 and $1000 quarterly for mains power. Nearly 7% were unsure of their average quarterly bill amount.
That’s it for this issue of the auSSII report. Next month, we’ll be revealing interesting information on Australians’ thoughts on price and quality. To be notified when new reports are released, subscribe to our weekly newsletter .
About The auSSII Report
SolarQuotes welcomes hundreds of thousands of visits each month, resulting in thousands of solar quotes provided by pre-vetted Australian installers participating in the SQ installer network. All this activity provides us with insights into what Australians who are considering purchasing a solar power system are thinking.
If you’d like to get 3 quotes from our pre-vetted installers, click here; or browse through our comprehensive database of solar installer reviews .
Installers – Learn more about the benefits of joining the SolarQuotes installer network. and how you can receive qualified solar sales leads.
Report Reproduction Guidelines
Reproduction of graphs and other detail from this report is welcome if this page is acknowledged as the source.

 RSS - Posts


Hello.
With the graphs, especially the graph for the paragraph heading “Where Was The Interest?”, could you please include data relative to populations?
So, for example, in a graph such as that one, or, I believe that it would need to be a separate graph, “interest” as a proportion of each state/territory population.
Thus, for example, while the graph published, shows interest from WA, as being just above 10% of the total interest shown for the country, perhaps, showing the data as a percentage of the population of each state/territory.
There is another aspect to all of this, also, in that the above information appears (I think) to not include the component – “I have an existing system, to which I would like to add (battery storage and/or ,ore generating capacity.”. I think inclusion of that kind of information, would also be interesting.
I am not making these points to belittle the information given – I am suggesting enhancement.
Sorry for the late reply, thanks for the suggestions Bret. I hope to do some population-weighted graphs down the track a little.