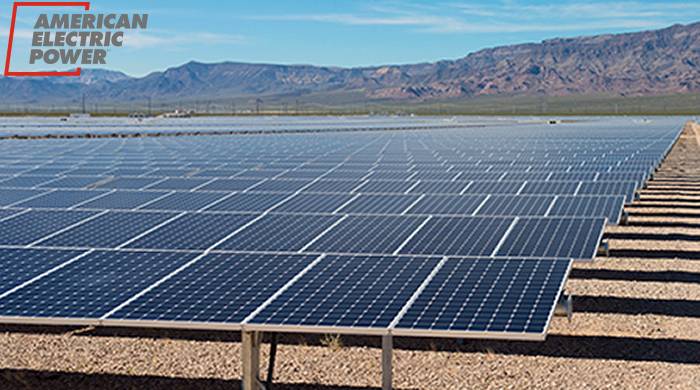
It may not be squeaky clean and green, but American Electric Power (AEP) has and will continue to make solid inroads into cutting carbon emissions, with some help from wind and solar power.
AEP is one of the largest electricity utilities in the USA, with close to 5.4 million customers in 11 states. The company has approximately 26,000 megawatts of generating capacity and more than 64,000 kilometres of transmission lines.
AEP announced last week it expects to invest USD$1.8 billion in new renewable energy generation from next year to the end of 2020.
The USD $1.8 billion in investments doesn’t include ae proposed $4.5 billion wind power project in Oklahoma. The Wind Catcher Energy Connection Project will be a 2,000-megawatt facility capable of delivering 9 million megawatt-hours of clean electricity annually.
Nicholas K. Akins, AEP chairman, president and chief executive officer, said in addition to Wind Catcher, the company has 3,570 megawatts of wind and solar generation in the pipeline; projects that will be constructed over the next seven years.
Looking further ahead and according to the company’s web site, it will have added 2,405 megawatts of solar capacity between 2018 and 2030, and 4,895 megawatts of wind power. As at April this year, its renewables portfolio consisted of 4.16 GW capacity. Among its current solar portfolio is the 50MW Boulder Solar II facility in Nevada. Built by SunPower, the solar farm began commercial operation in January 2017.
While AEP has retired about 25 percent of its coal-fired generating capacity, it still sees a future for the little black rock and has been spending a bundle of cash on making its coal fleet comply with tighter environmental regulations – approximately USD $8.7 billion between 2000 and 2017.
The Trump Administration is repealing previous president Barack Obama’s Clean Power Plan, but AEP says that won’t change its focus on meeting the needs and expectations of its customers.
” That includes diversifying our resource mix and investing in renewable generation and other innovations that increase efficiency and reduce emissions,” states the company. “We also believe that regardless of the outcome of legal challenges to the Clean Power Plan (CPP), it is likely there will be some form of carbon regulation in the future.”
AEP reports its CO2 emissions decreased 9% between 2015 and 2016, primarily due to it retiring coal generators; with other factors including cheaper natural gas, increased use of renewables and slowing load growth. The company has reduced emissions 44 percent compared with 2000 and this year, it estimates CO2 emissions will be further reduced to 56 percent below 2000 levels.


 RSS - Posts


The sooner that we get a double dissolution election from the members of the feral parliament (especially the feral government) losing their seats due to having never been eligible to be members of the parliament, so that the country no longer has this caveman government (“I love the smell of coal smoke, all day, every day”), and gets a government that is concerned about having a future ( and, especially, having healthy children) free of coal smoke, the better, so that clean energy generation can be increased in Australia, to catch up with the rest of the world.
Australia may yet, even make it out of this Dark Age, and, into the twentieth century.
I note that the table published at
http://reneweconomy.com.au/wp-content/uploads/2017/11/Screen-Shot-2017-11-02-at-2.56.40-PM.png
includes data from two states of the USA, for comparison with Australia, but, does not include the data for the whole of the USA.
It would be interesting, to compare, in the context of the above article, the percentages of total energy generation, for each of “Fossil Fuel”, Hydro, Wind, and, PV, for the whole of the USA, and, the whole of Australia, for the same period.
Info for US, see
https://www.eia.gov/electricity/monthly/epm_table_grapher.php?t=epmt_1_1
The US EPA has the figures for the United States’ electricity generation in 2016 here:
https://www.eia.gov/tools/faqs/faq.php?id=427&t=3
33% gas
30.4% coal
19.7% nuclear
6.5% Hydroelectricity (Appears higher than usual for US)
5.6% Wind (Lowest cost wind in the world)
1.5% biomass
0.9% solar
0.6% petroleum
0.4% Geothermal
0.3% other gases (LPG?)
0.3% other nonrenewable sources
-0.2% pumped storage (This is negative due to storage losses.)
So it appears that California and Texas have higher percentages of electricity generation from “Wind & PV” than the Australian NEM, but the USA overall, has a lower percentage than the Australian NEM (although, the data for the USA overall, is for 2016, rather than 2017YTD).
I note that the Australian NEM does not include WA.