Last Updated: 1st Mar 2025 By Finn Peacock, Chartered Electrical Engineer, Fact Checked By Ronald Brakels
Are Solar Batteries Worth It?
Summary: In 2025, if you are on a flat-rate tariff anywhere except South Australia and Western Australia, battery payback will likely be over 12 years. But – in a best case situation – if you are on a time-of-use tariff anywhere except NT or TAS, a solar battery can pay for itself in under 10 years and sometimes in under 5. Read on for the details:
Considering a solar battery but unsure if it’s worth the investment? You’re in good company. Back in 2015 when home batteries hit the Aussie market, the payback period was a hefty 20 years or more. Fast forward to today: battery costs have dropped, while electricity prices have skyrocketed. Result? More Aussies are finding solar batteries are indeed worth it. But it’s not a one-size-fits-all scenario. Your location, tariff, and energy habits will make or break the payback.
In this guide, I’ll break down typical savings and paybacks across different states, territories and tariffs in Australia so you can decide if a battery is worth it for you.
Pro-Tip: This page is all about the financial returns of solar batteries. But batteries have more value than just low electricity bills. They provide blackout protection, help integrate more renewables into the grid and provide insurance against changing electricity tariffs.
Solar Battery Payback
Let’s cut right to the chase. What are average simple payback times for a 10kWh, $10,000 battery per state/territory? We calculated these numbers using the total estimated first first-year battery savings in the table below.
| State/Territory | Flat Tariff: Payback | TOU Tariff: Payback |
|---|---|---|
| ACT | 11.8 years | 8.9 years |
| NSW | 9.6 years | 5.8 years |
| NT | 12.8 years | 13.5 years |
| QLD | 11.1 years | 8.3 years |
| SA | 7.8 years | 4.6 years |
| TAS | 13.9 years | 10.3 years |
| VIC | 12.5 years | 9 years |
| WA | 9.3 years | 6.1 years |
First-Year Battery Savings
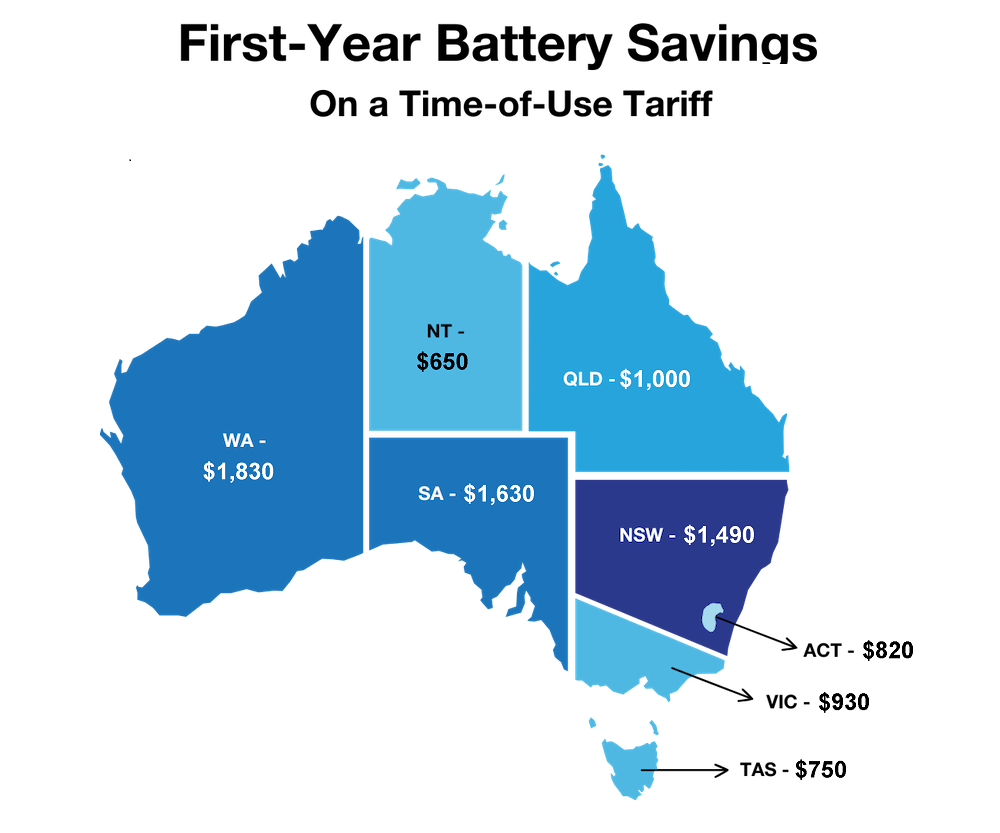
Here’s what you could save in the first year with a 10kWh battery that costs $10,000 installed. Using electricity plans suitable for solar households in each state or territory capital, I’ve considered both flat and time-of-use (ToU) tariffs. Below the table, there’s a map of how the states and territories compare on ToU tariffs.
Assumptions:
- The battery has a round-trip efficiency of 90%.
- Charged with rooftop solar panels.
- 100% of the battery’s storage capacity is used each day.
| State/Territory | Annual Savings: Flat Tariff | Annual Savings: ToU Tariff |
|---|---|---|
| ACT | $550 | $820 |
| NSW | $820 | $1,490 |
| NT | $690 | $650 |
| QLD | $690 | $1,000 |
| SA | $1,280 | $1,630 |
| TAS | $720 | $750 |
| VIC | $620 | $930 |
| WA | $1,070 | $1,830 |

Why are Time-Of-Use tariff savings higher than Flat Tariff savings?
If you have a flat-rate tariff, you save money by charging your battery off solar and discharging it after the sun goes down. For every kWh of battery energy you use in the evening, you will save the grid cost of that kWh minus the forgone feed-in tariff (because you chose to put the solar electricity into the battery instead of selling it into the grid). So your daily savings are capped at the battery capacity times about 30 cents. For a 10 kWh solar battery, that’s $3 per day.
A time-of-use tariff charges much more for grid electricity during the evening peak (up to 65c per kWh), so using battery energy in the evening saves you more.
Pro-Tip: Increasing numbers of Australian homes are being forced onto ToU plans, but if you have a choice of flat or ToU plans, these savings assume households without a battery are either better off on a ToU plan or would pay roughly the same amount if they were on a ToU plan.
Additional Savings From Avoiding The Morning Peak
If you drain your battery in the evening, on a ToU tariff, you can often recharge it overnight to get you through the morning peak pricing period. This can add to your savings. Discharging 5kWh in the morning – half a 10kWh solar battery’s capacity – will do the following:
| State/Territory | Additional ‘Morning Peak’ Savings |
|---|---|
| ACT | $195 |
| NSW | $45 |
| NT | $95 |
| QLD | $25 |
| SA | $370 |
| TAS | $225 |
| VIC | Increases bills |
| WA | Increases bills |
Virtual Power Plants (VPPs)
Joining a VPP can further boost your savings. You could also receive an upfront discount on the cost of a battery. However, be mindful of the potential disadvantages:
- Your battery will restrict which VPPs you can join.
- Normally, you’ll be restricted to a specific electricity retailer and plan
- Loss of control over battery usage
- Increased battery wear and tear
Estimated Annual VPP Savings:
| State/Territory | VPP Savings |
|---|---|
| ACT | $100 |
| NSW | $180 |
| NT | No VPPs available |
| QLD | $180 |
| SA | $180 |
| TAS | Trials only |
| VIC | $180 |
| WA | Trials only |
Pro-Tip: Compare Australian VPPs with my VPP Comparison Table
Total Estimated 1st Year Battery Savings
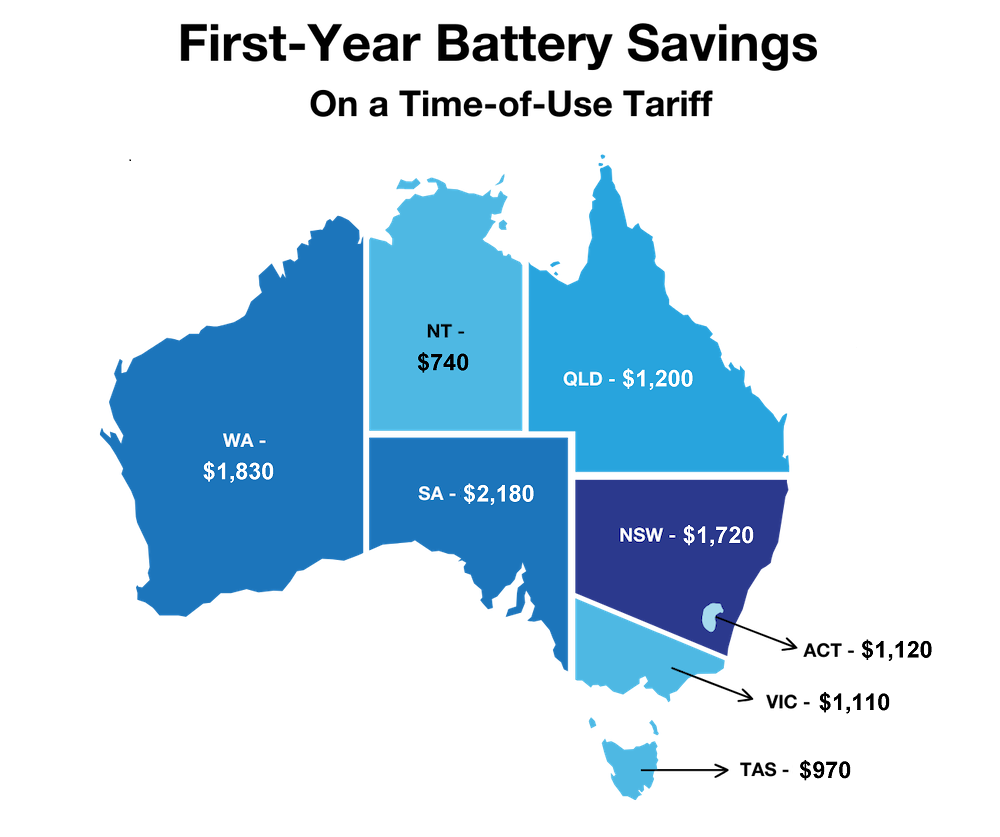
Combining all these factors, here are the estimated total first-year savings combining:
- A 100% discharge in the evening
- Where it makes sense, a 50% discharge in the morning
- Estimated VPP savings
| State/Territory | Flat Tariff Total Savings | TOU Tariff Total Savings |
|---|---|---|
| ACT | $850 | $1,120 |
| NSW | $1,040 | $1,720 |
| NT | $780 | $740 |
| QLD | $900 | $1,200 |
| SA | $1,280 | $2,180 |
| TAS | $720 | $970 |
| VIC | $800 | $1,110 |
| WA | $1,070 | $1,630 |

Things to Watch Out For
- TOU vs flat tariffs
- Capacity loss over time
- Changing electricity prices, feed-in tariffs and VPP payments
- You may not fully utilise the battery every day
Time-of-Use (TOU) Peak Times by State
Understanding TOU peak times is crucial when considering if solar batteries are worth it. The longer and more frequent the peak pricing periods are, the more likely you are to use all your battery capacity every day to avoid them.
| State/Territory | Usual Peak Periods | Weekends |
|---|---|---|
| ACT | 3 to 4-hr Evening, 2-hr Morning | Yes |
| NSW | 6-hr Evening | Varies |
| NT | 12-hr Daytime | No |
| QLD | 4 to 5-hr Evening | Varies |
| SA | 10-hr Evening, 4-hr Morning | Yes |
| TAS | 5-hr Evening, 3-hr Morning | No |
| VIC | 5-hr Evening | Yes |
| WA | 5-hr Evening | Yes |
Key Takeaways:
- SA has the longest evening and morning peak periods, giving batteries there an advantage.
- NT has a peak during the day from 6am to 6pm which reduces the return from batteries, but this is likely to change with the next couple of years.
Capital Costs
The paybacks above do not include the cost of money, AKA ‘Capital costs’. These are often overlooked but are vital in the total cost equation of owning a home battery.
Here’s why:
Interest Rates vs Inflation
If you’re not spending money on a solar battery, there’s a good chance you’re using that cash to pay off your home loan instead. Right now, the average home loan interest rate is over 6%. But if inflation is around 4%, the ‘real cost’ of using your money for something else—like a solar battery—is actually closer to 2%.
Future Outlook on Capital Costs
Current interest rates are the highest they’ve been for the past 12 years. They are likely to fall and could make a 1% cost of capital a reasonable figure to use in the not-too-distant future. Over a 10-year period, a $10,000 investment at a 1% cost of capital would amount to $11,050—adding roughly $1,000 to the cost of your initial investment.
Electricity Price Outlook
The savings above assume a constant electricity price, but electricity prices may rise or fall in the future.
Playing The Wholesale Market With Your Battery
One way to get outsized financial returns from your battery is to enrol in an electricity plan that exposes you to the wholesale electricity spot price – a price that can go as low as negative $1 to as high as $15 or more per kWh. Energy retailer Amber Electric offers such a service. The theory is that you can make loads of money if your battery charges when prices are low and discharges when they’re crazy high. Certainly, some people with large solar batteries and flexible loads report making thousands of dollars over 12 months doing this. But be careful, as with most high-reward activities, there is a risk of getting it wrong and getting giant electricity bills (capped at the Default Market Offer) instead. For advanced players only.
Tools for Better Decision Making
Add A Battery Calculator: Quickly see your payback if you add a battery to an existing solar system. Uses your smart meter data to calculate how much spare solar you’ve got for charging and how much energy you use overnight. The result is a no-BS payback figure for your unique situation.
Solar & Battery Calculator: Quickly see estimated savings and payback when you combine a battery with solar power. Crucially, my calculator will split the solar and battery payback so you can decide if a solar battery is worth it.
Energy Tariff Comparison Tool: Your retail tariff affects your battery payback. Quickly see what’s offered in your area, and sort them easily.
VPP Comparison Tool: See what VPPs are available in your area.
Solar Batteries compared: Compare solar batteries available in Australia.
If you’ve decided that solar batteries are worth it for you and are ready to buy, I can help arrange quotes from installers I trust – quickly and easily: